
Exploring the y-intercept of a line
Loading the math board and drawing, please wait…
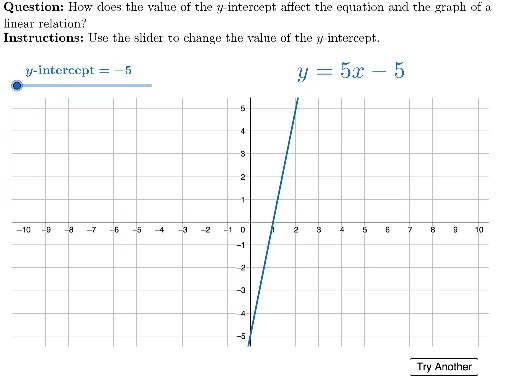
This example demonstrates how to observe the change in the y-intercept by dynamically adjusting the slope and y-intercept of a line. The core mathematical concepts involved include linear equations, coordinate systems, and function graphs. Key construction elements use GeoGebra commands like If, LaTeX, Polygon, and objects such as TryAnother, m, b, f, equation, bLabel, viewBox, QUESTION, INSTRUCTIONS, TEXT. Suitable for middle school and above students to understand the relationship between linear equations and y-intercepts, as well as basic operations of dynamic geometry software.
GeoGebra Commands & Parameters
If(Random[0, 1] ≟ 0, Random[-6, -1], Random[1, 6]) → mLaTeX("\vphantom{1}" + f) → equationLaTeX(("y\text{-intercept}=" * b)) → bLabelPolygon({(-10.5, -5.5), (-10.5, 5.5), (10.5, 5.5), (10.5, -5.5)}) → viewBoxLaTeX("\textbf{Question: }How does the value of the \(y\)-intercept affect the equation and the graph of a\\linear relation?") → QUESTIONLaTeX("\textbf{Instructions: }Use the slider to change the value of the \(y\)-intercept.") → INSTRUCTIONS