
Fraction Multiplication Visualization: Bar Chart and Unit Circle Linkage
Loading the math board and drawing, please wait…
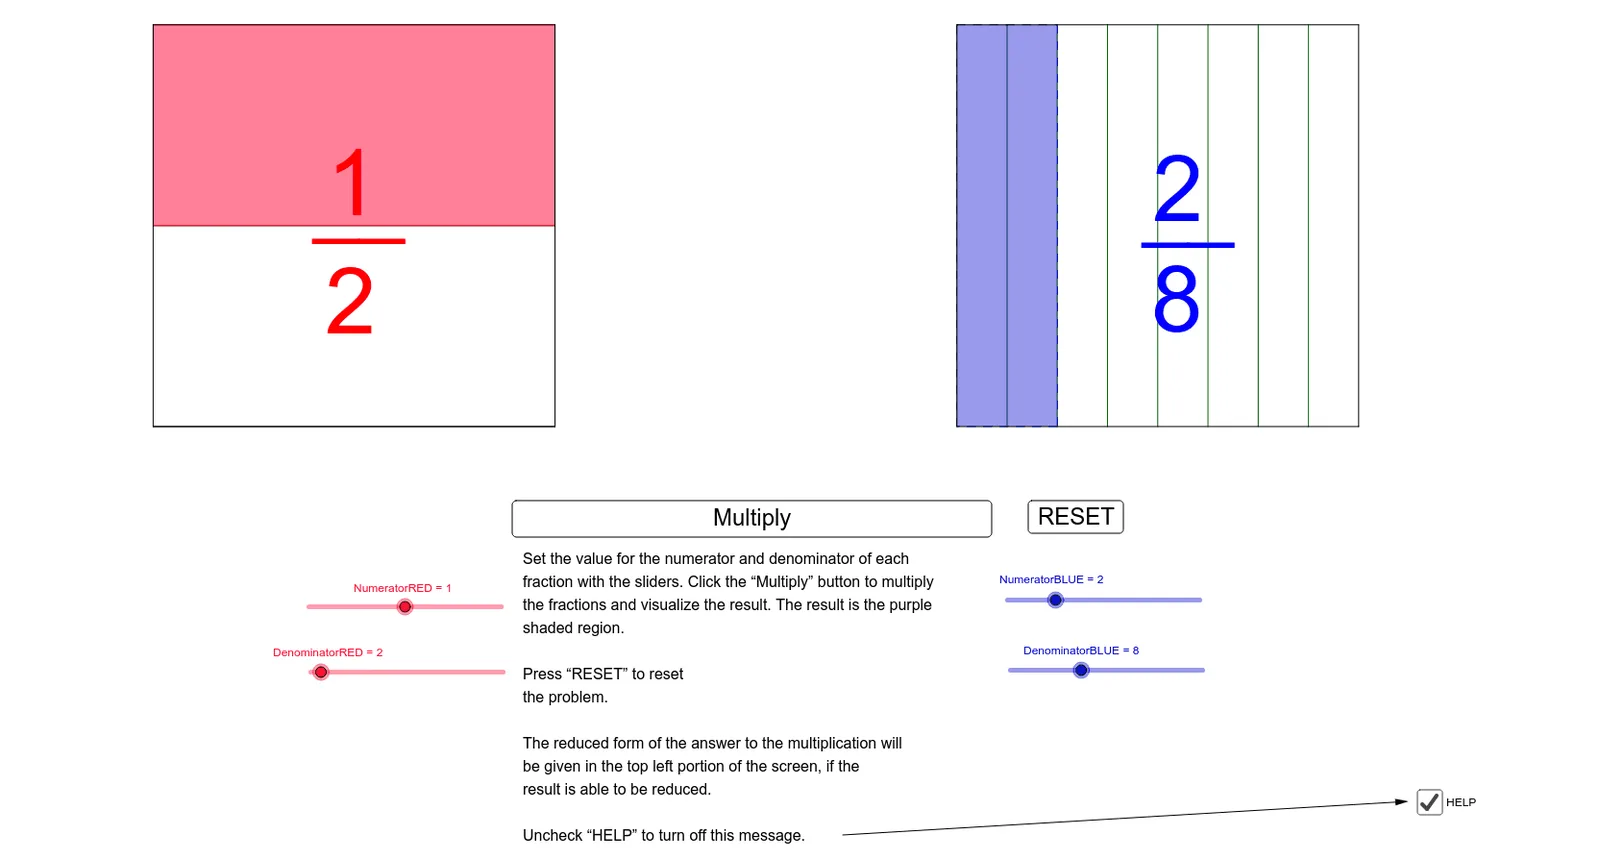
① This example demonstrates the geometric meaning and numerical result of multiplying two fractions through a linked bar chart and unit circle. ② Core math concepts include fraction multiplication, proportional reasoning, trigonometric functions (sine/cosine on the unit circle), and statistical variance, combining algebraic operations with geometric representations. ③ Construction highlights: using GeoGebra commands such as Polygon, Sequence, Segment, FractionText, and Vector to build fraction bars and vectors; controlling numerators and denominators via objects like NumeratorRED and DenominatorRED; representing product areas with polygons poly1 to poly4; using lists L1 to L6 and sliders s and r for dynamic adjustments; linking points on the unit circle to trigonometric values. ④ Suitable for upper elementary to middle school students to grasp an intuitive model of fraction multiplication, and also useful for high school review of the connection between ratios and trigonometry, or as a reference for teachers creating interactive lessons.
GeoGebra Commands & Parameters
Polygon(A, B, 4) → poly1, f, g, h, i, C, DPolygon(E, F, 4) → poly2, j, k, l, m, G, HSequence(A + (i * (D - A)), i, 0, 1, 1 / DenominatorRED) → L1Sequence(B + (i * (C - B)), i, 0, 1, 1 / DenominatorRED) → L2Sequence(Segment[Element[L1, k], Element[L2, k]], k, 2, DenominatorRED) → L3Polygon(D, C, S, R) → poly3, d_1, c_1, s, rSequence(E + (i * (F - E)), i, 0, 1, 1 / DenominatorBLUE) → L4Sequence(H + (i * (G - H)), i, 0, 1, 1 / DenominatorBLUE) → L5Sequence(Segment[Element[L4, k], Element[L5, k]], k, 2, DenominatorBLUE) → L6Polygon(U, T, E, H) → poly4, u, t, e_1, h_1Segment(A, B) → nSegment(A, D) → pSegment(B, C) → qSegment(E, F) → a_1Segment(E, H) → b_1Segment(H, G) → f_1Segment(G, F) → g_1Segment(A, B) → i_1Segment(D, C) → j_1FractionText(numerator / denominator) → text17Vector(I, J) → v
AI Drawing Prompt Reference
Draw a visualization of fraction multiplication with a bar chart and a unit circle. Start by creating two fraction bars, then use these bars to create four small rectangular areas representing the product. Adjust the numerators and denominators with sliders to dynamically show these changes. Finally, connect points and segments on the unit circle to represent sine and cosine values.
The prompt above was compiled from the original drawing commands and is for reference only.