
Fr-Boxplots: Boxplot and Statistics Demonstration
Loading the math board and drawing, please wait…
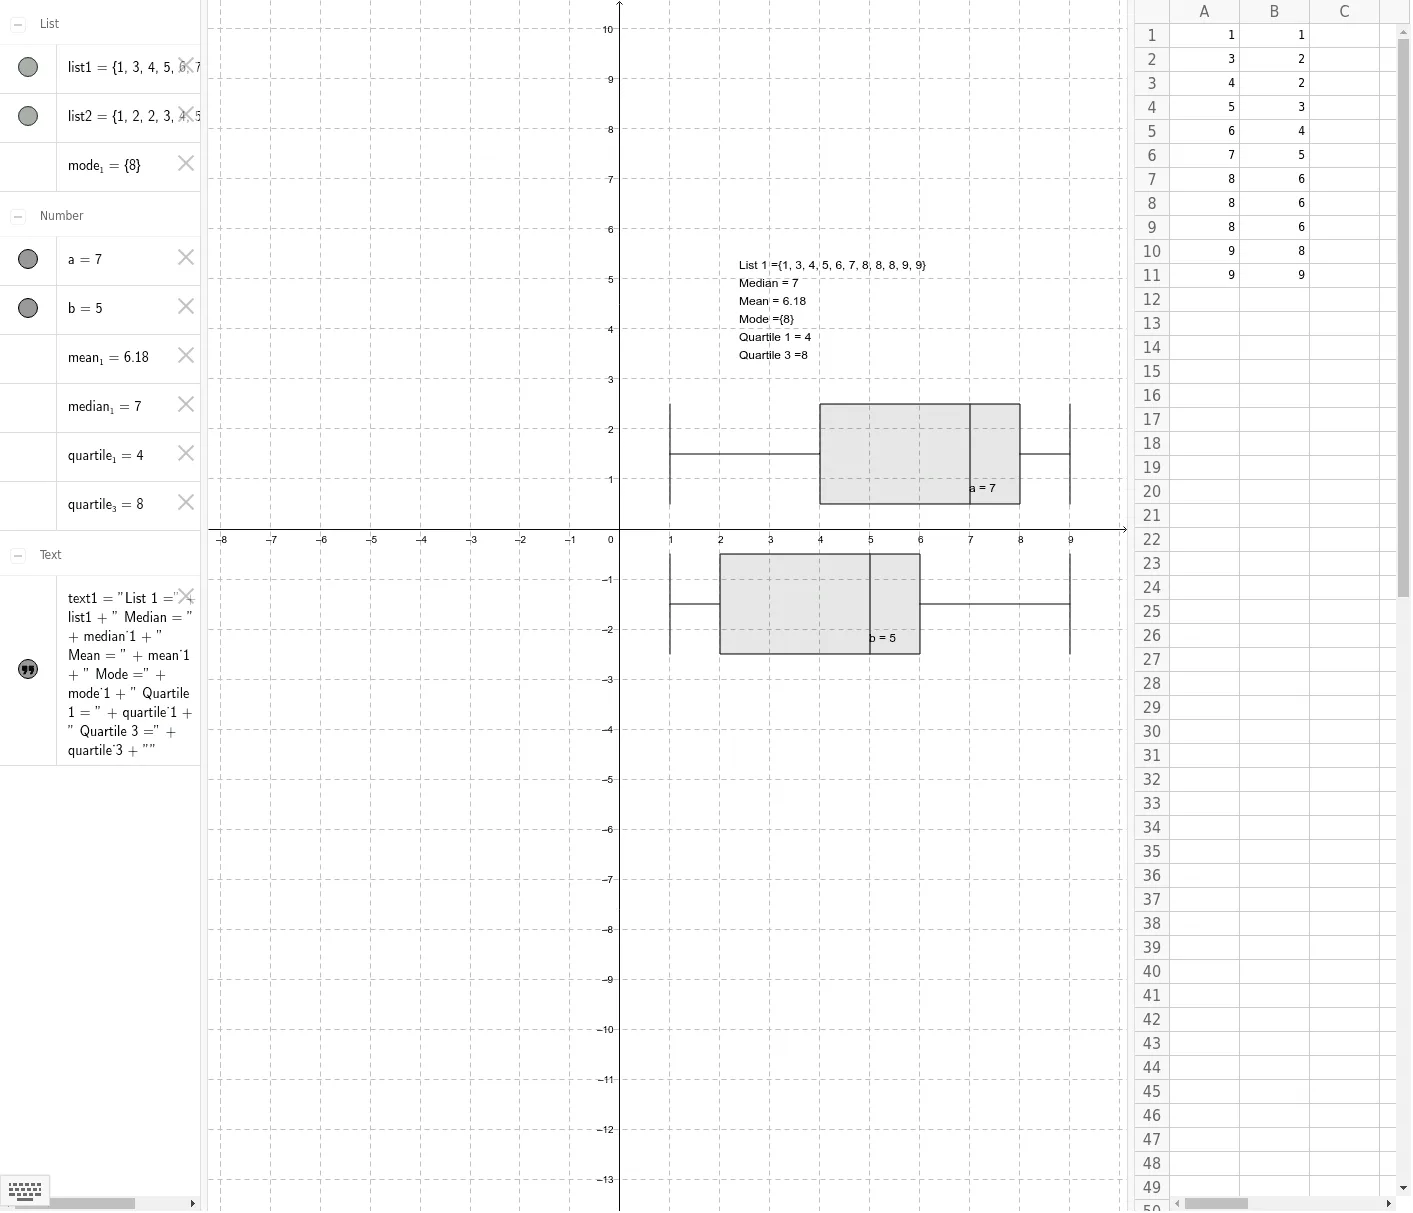
① This GeoGebra example dynamically displays a boxplot of a dataset along with key statistics, clearly showing the distribution shape. ② Core math concepts include boxplots, mean, median, mode, quartiles (Q1, Q3), linear equations, sequences, and random variables, emphasizing descriptive statistics. ③ Construction highlights: uses the BoxPlot command to draw the boxplot, and Mean, Median, Mode, Q1, Q3 commands to compute statistics; objects include points (A1~A11, B1~B11), lists list1 and list2, parameters a and b, and text1 for displaying results. ④ Suitable for high school or introductory college statistics courses, and for data visualization activities to help students understand central tendency and spread.
GeoGebra Commands & Parameters
BoxPlot(1.5, 1, list1) → aBoxPlot(-1.5, 1, list2) → bMean(list1) → mean_1Median(list1) → median_1Mode(list1) → mode_1Q1(list1) → quartile_1Q3(list1) → quartile_3
AI Drawing Prompt Reference
Create a statistical demonstration graphic showing two boxplots placed horizontally, one above the x-axis and one below, representing two different datasets. Each boxplot should clearly display the minimum, first quartile, median, third quartile, and maximum, with the mean, median, mode, Q1, and Q3 values labeled nearby. Include point markers for the data values and sliders to adjust parameters affecting the data distribution. The layout should emphasize the shape of the distributions and central tendency, suitable for classroom teaching.
The prompt above was compiled from the original drawing commands and is for reference only.