
H-Derivatives Demo
Loading the math board and drawing, please wait…
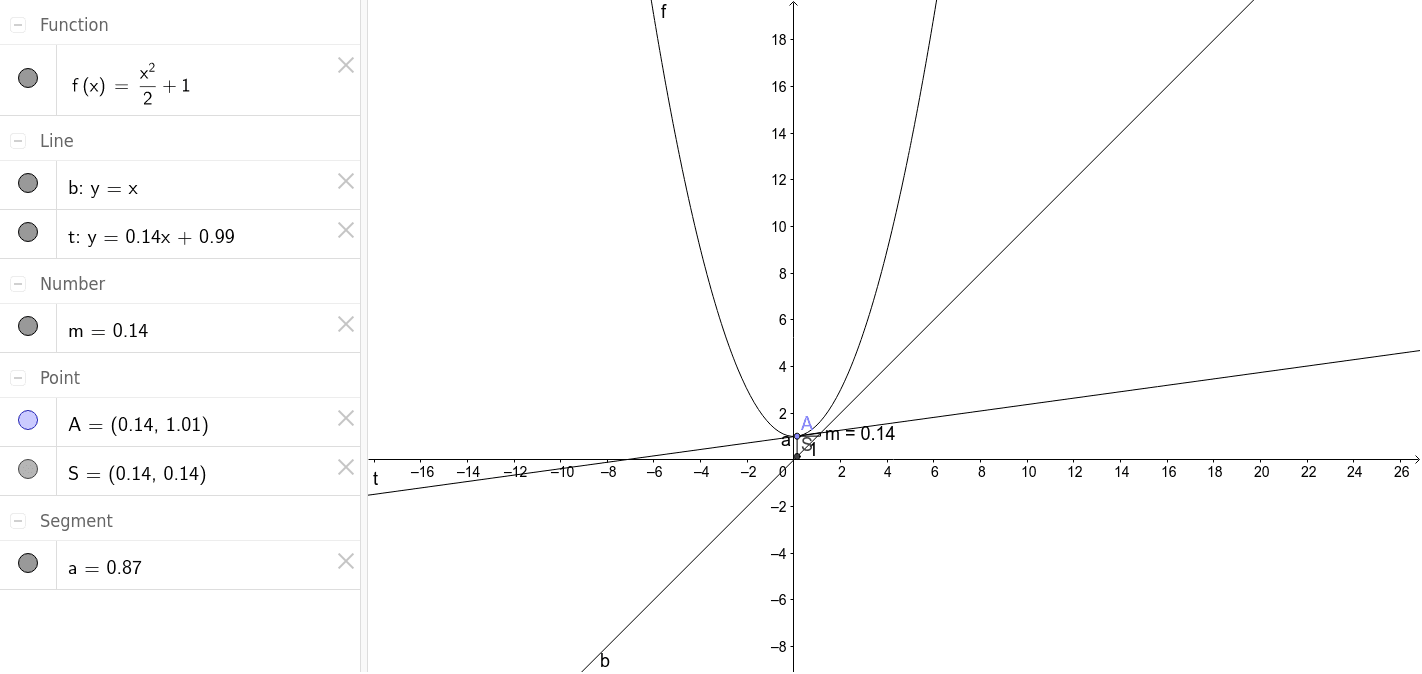
This example demonstrates the geometric meaning of H-derivatives (higher-order derivatives) on a function's graph by dynamically adjusting parameters to observe derivative changes. Key math concepts include derivatives, linear functions, rational numbers, linear regression, translation, and dilation. GeoGebra commands and objects used in construction are Point, Tangent, Slope, Segment, with objects f, A, t, m, S, a, b. Suitable for high school and above learners to understand the application and geometric intuition of higher-order derivatives.
GeoGebra Commands & Parameters
Point(f) → ATangent(A, f) → tSlope(t) → mSegment(A, S) → a
AI Drawing Prompt Reference
Draw a graph of a function with a movable point on it. At this point, construct a tangent line to the curve and display its slope. From the point, draw a segment to another point on the curve to illustrate the geometric meaning of higher-order derivatives. Use sliders to dynamically adjust parameters, allowing observation of how the tangent slope and segment change, thereby understanding the relationship between derivatives and the function graph. The figure should include the function curve, the movable point, the tangent line, slope annotation, and connecting segment, with a clear layout for observing derivative variations.
The prompt above was compiled from the original drawing commands and is for reference only.