
Linear Inequalities Project
Loading the math board and drawing, please wait…
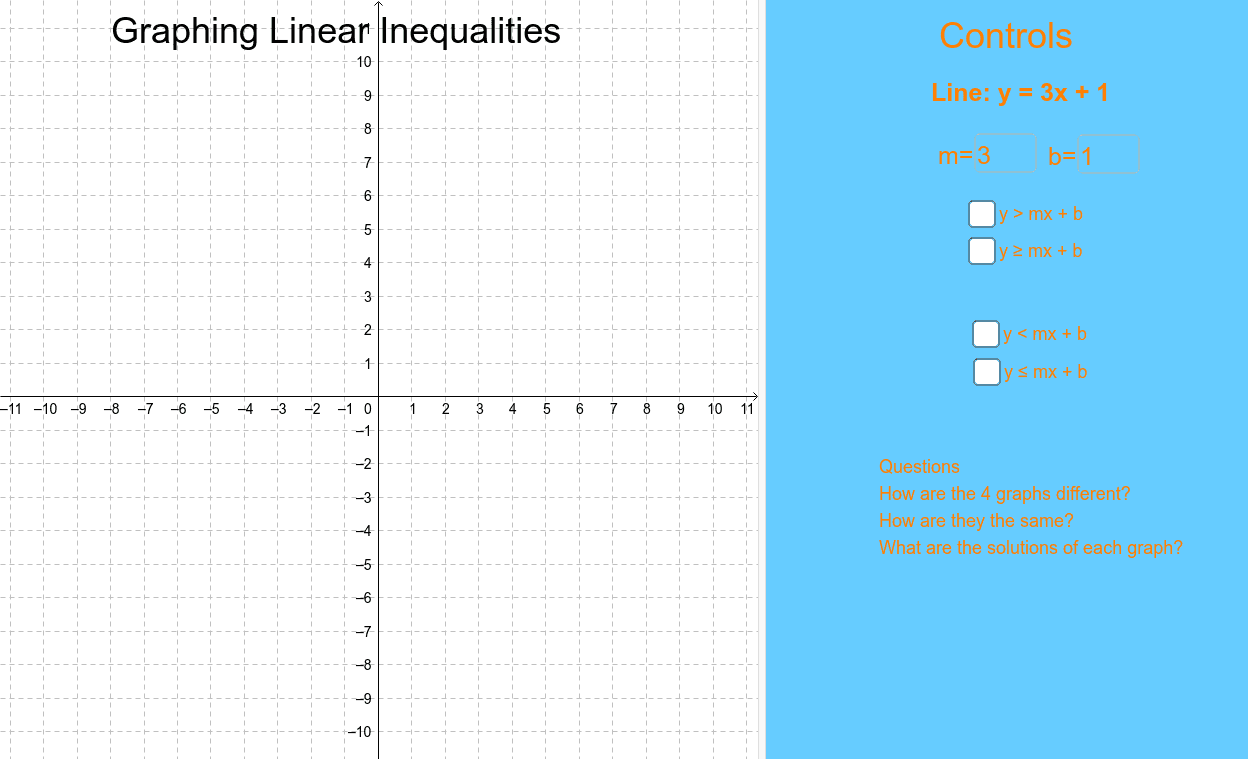
This example demonstrates the graphical representation and region division of linear inequalities in a coordinate system. Core math concepts include linear equations, solution sets of inequalities, boundary lines, and area representation. Construction highlights the use of Textfield commands for text boxes, InputBox objects for user input, and variable definitions like m, b, a, c, d, e, f, g, h, i. Suitable for high school students to learn and understand the geometric meaning of linear inequalities, aiding classroom demonstrations and supplementary teaching materials.
GeoGebra Commands & Parameters
Textfield(m) → InputBox1Textfield(b) → InputBox2
AI Drawing Prompt Reference
Draw two lines in a coordinate system defined by parameters m and b, showing their intersections with the x-axis and y-axis. Fill the region between the lines with different colors to represent the solution set of the inequality. Add text boxes to display the values of parameters m and b for user input and adjustment.
The prompt above was compiled from the original drawing commands and is for reference only.