
Find Slope From Two Points: Linear Function Slope Quiz Generator (V2)
Loading the math board and drawing, please wait…
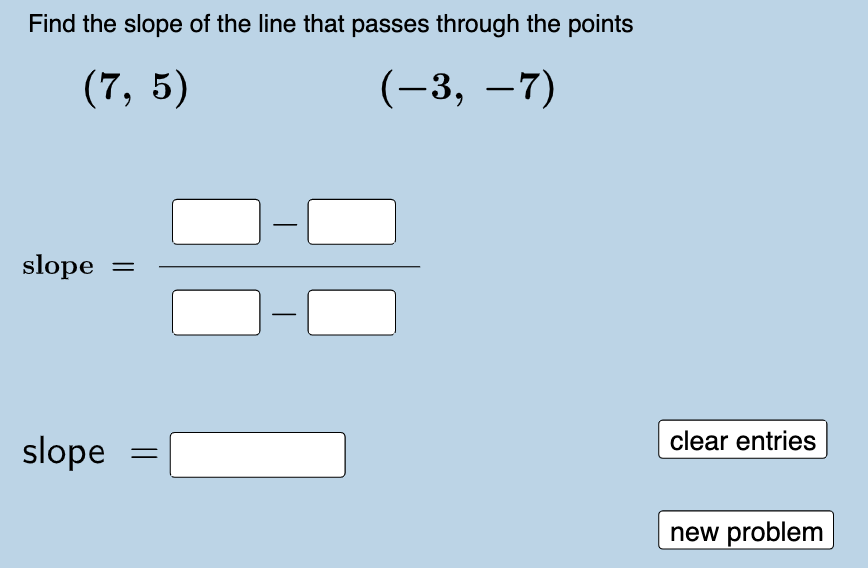
This example demonstrates an interactive quiz generator that creates problems for finding the slope of a straight line from two given points, linking the graph-based idea of “rise over run” to the algebraic calculation. The core concepts are slope, linear functions/linear equations, and the fact that two points determine a line. Construction-wise, it uses Sequence and RandomElement to generate random coordinate pairs, Union to combine candidate sets, and FractionText together with Textfield to display answers and accept user input in a fraction-friendly form. It manages coordinate data via list objects such as xlist/ylist (and related xlist1/xlist2) and uses multiple InputBox controls and buttons to generate questions, submit responses, and show feedback, while text objects (text1, text2, etc.) render the prompt and guidance. Suitable for middle and high school students learning linear functions and for teachers who want rapid, parameterized practice.
GeoGebra Commands & Parameters
Sequence(i, i, -10, 10, 1) → ylist, {-10, -9, -8, -7, -6, -5, -4, -3, -2, -1, 0, 1, 2, 3, 4, 5, 6, 7, 8, 9, 10}Sequence(i, i, -10, 10, 1) → xlist, {-10, -9, -8, -7, -6, -5, -4, -3, -2, -1, 0, 1, 2, 3, 4, 5, 6, 7, 8, 9, 10}RandomElement(xlist) → aSequence(i, i, a + 1, 10, 1) → xlist2, {8, 9, 10}Sequence(i, i, -10, a - 1, 1) → xlist1, {-10, -9, -8, -7, -6, -5, -4, -3, -2, -1, 0, 1, 2, 3, 4, 5, 6}Union(xlist1, xlist2) → list1RandomElement(list1) → cRandomElement(ylist) → bRandomElement(ylist) → dFractionText(e) → text1Textfield(f) → InputBox1Textfield(g) → InputBox2Textfield(h) → InputBox3Textfield(i) → InputBox4Textfield(j) → InputBox5
AI Drawing Prompt Reference
Draw an interactive quiz generator graphic with two point coordinate input boxes, answer input boxes, and feedback text. The graphic should show how to calculate slope from two given points, linking graphical concepts to algebraic calculations. The construction order is: first create coordinate lists, then randomly generate point coordinates, merge lists, then generate questions and display prompts.
The prompt above was compiled from the original drawing commands and is for reference only.