
Farmer Farrar's Fencing: Fence Area Observation
Loading the math board and drawing, please wait…
In collections
Perimeters vs. Areas
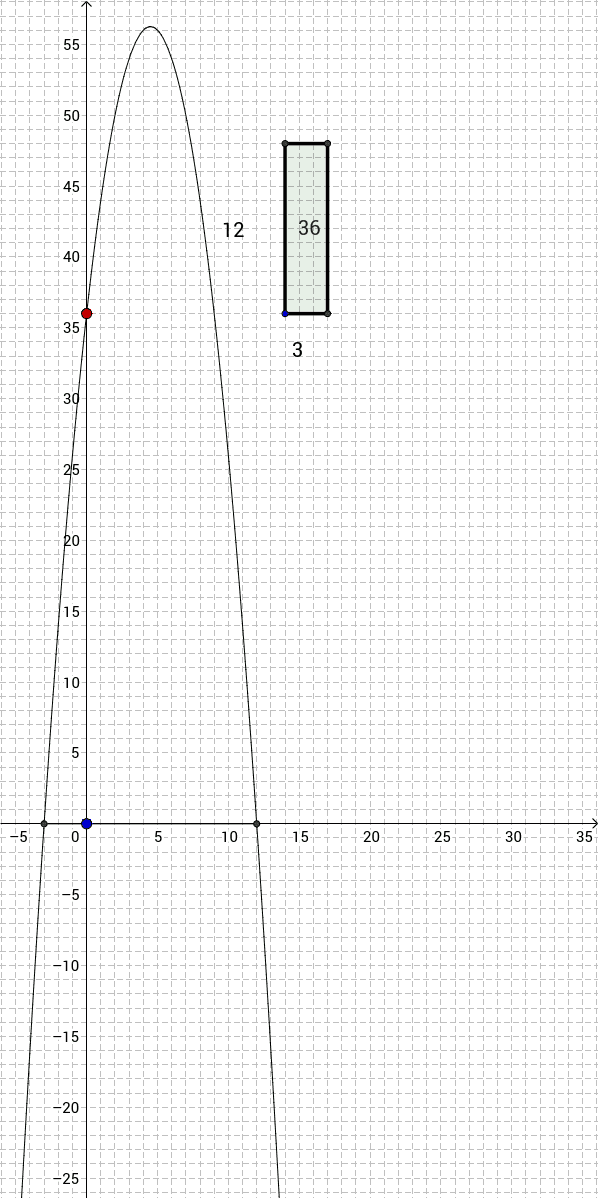
This example demonstrates the effect of changing dimensions on the area of a rectangle. It involves core math concepts like the area formula of a rectangle, variable relationships, and function graphs. Construction highlights include using GeoGebra commands such as Intersect, Segment, Point, Circle, Line, Polygon, and OrthogonalLine. Suitable for middle school and above, it helps students understand the connection between functions and geometric shapes, fostering spatial reasoning skills.
GeoGebra Commands & Parameters
Intersect(f, xAxis) → A, BSegment(A, B) → aPoint(a) → CCircle(D, 12 - x(C)) → cCircle(D, 3 + x(C)) → eLine(D, xAxis) → bLine(D, yAxis) → hIntersect(c, h, 2) → ECircle(E, 3 + x(C)) → dLine(E, xAxis) → gIntersect(e, b, 2) → FIntersect(d, g, 2) → GPolygon(D, F, G, E) → poly1, d_1, f_1, g_1, e_1OrthogonalLine(C, xAxis) → iIntersect(f, i) → H
AI Drawing Prompt Reference
Draw a rectangle with one side fixed on the x-axis and the other side moving along the x-axis to change its length, demonstrating how the area changes with the side length. From one vertex of the rectangle, draw two circles: one whose radius decreases as the side length increases, and another whose radius increases. Connect the center of the circles to the x and y axes, find intersection points, draw circles at these points, and connect them to form a new polygon. Finally, connect the rectangle's vertex to the moving point to show the relationship between functions and geometric shapes.
The prompt above was compiled from the original drawing commands and is for reference only.