
Extrema Identification Quiz for Functions
Loading the math board and drawing, please wait…
In collections
Fun with Functions
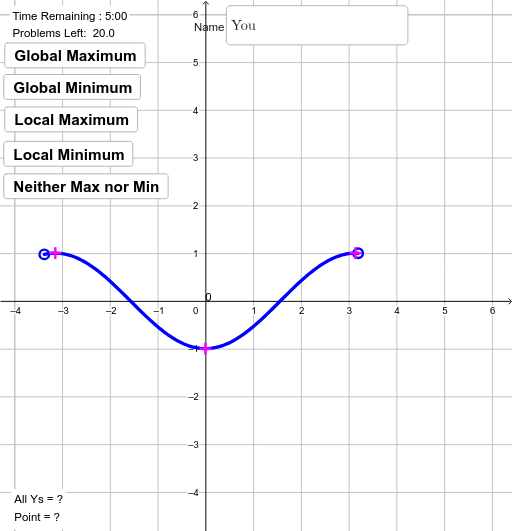
This interactive quiz helps learners identify local minimum and maximum points on function graphs. It randomly generates polynomial functions and displays candidate points on the curve, challenging users to determine which are extrema. The core mathematical concepts include local extrema (maxima and minima), polynomial function behavior, and criteria for identifying extreme points. The construction uses GeoGebra commands such as Polynomial to generate random polynomials, Min and Max to compute extrema, If and RemoveUndefined for conditional logic, RandomElement to select random functions and points, and Textfield for user input. It is suitable for high school or introductory college calculus students to reinforce their understanding of extrema and graph reading skills, and can serve as an engaging classroom activity or self-assessment tool.
GeoGebra Commands & Parameters
Polynomial({A, B, C, D, E, F, G, H, I}) → p_1Polynomial({A, B, C, G, H, I}) → p_4Polynomial({J, B, K, L, H, M}) → p_3Polynomial({J, C, E, G, M}) → p_2Min(right, split) → lefttopIf(na > 4, Zip[If[left < x(PK) < lefttop, PK], PK, Element[pklist_1, na - 4]]) → pkzLMax(split, left) → rightbotIf(na > 22 ∧ lefttop > 0 ∨ nb > 22 ∧ rightbot < 0, (0, 0)) → addpntIf(left < lefttop, If[na > 4, pkzL, {Extremum[fa, left, lefttop]}], {}) → extPtsLeftIf(rightbot < right, If[nb > 4, pkzR, {Extremum[fb, rightbot, right]}], {}) → extPtsRightIf(second < 10, "0", "") → sec0RemoveUndefined(Union[{Aleft, Aright, Bleft, Bright, addpnt}, Union[extPtsLeft, extPtsRight]]) → allptsMax(ys) → globMaxMin(ys) → globMinRandomElement(allpts) → caseTextfield(name) → InputBox1
AI Drawing Prompt Reference
Create an interactive quiz graph for identifying extrema of functions. Display a randomly generated polynomial curve with several candidate points marked on it, including local maxima and minima. The graph should show the function's behavior over its domain, highlight extremum positions, and include an input box for user answers. The layout must clearly present the curve, candidate points, and visual cues needed for extremum identification, suitable for high school or introductory calculus practice.
The prompt above was compiled from the original drawing commands and is for reference only.