
Exponentials and Logarithms by Kathryn Peake
Loading the math board and drawing, please wait…
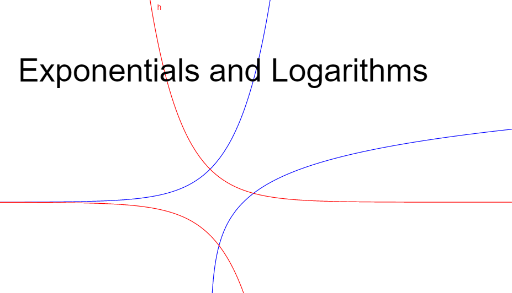
This GeoGebra interactive example demonstrates the visual comparison and geometric properties of exponential and logarithmic functions, showing their characteristic curves, growth behaviors, and inverse symmetry across the diagonal line. Core mathematical concepts covered include exponential growth, logarithmic decay, inverse functions, base variation effects, and the intersection of these curves with axes. In terms of construction, the model defines key mathematical functions f, g, and h to render distinct curves, utilizes the text object text1 to provide clear mathematical annotations and labels, and incorporates the geometric object p to facilitate user-driven sliders and interactive points. This dynamic visualization is ideal for high school algebra, pre-calculus, and college-level mathematics courses, assisting teachers in delivering engaging, concept-driven lessons on transcendental functions.
GeoGebra Commands & Parameters
f(x) = ℯ^(x)g(x) = log(x)h(x) = ℯ^((-x))p(x) = (-ℯ^(x))
AI Drawing Prompt Reference
Draw the graphs of exponential and logarithmic functions, including f(x) = e^x, g(x) = log(x), h(x) = e^(-x), and p(x) = -e^x. Use sliders to adjust parameters and demonstrate the characteristic curves, growth behaviors, and inverse symmetry across the diagonal line.
The prompt above was compiled from the original drawing commands and is for reference only.