
CAST and Tan Graph
Loading the math board and drawing, please wait…
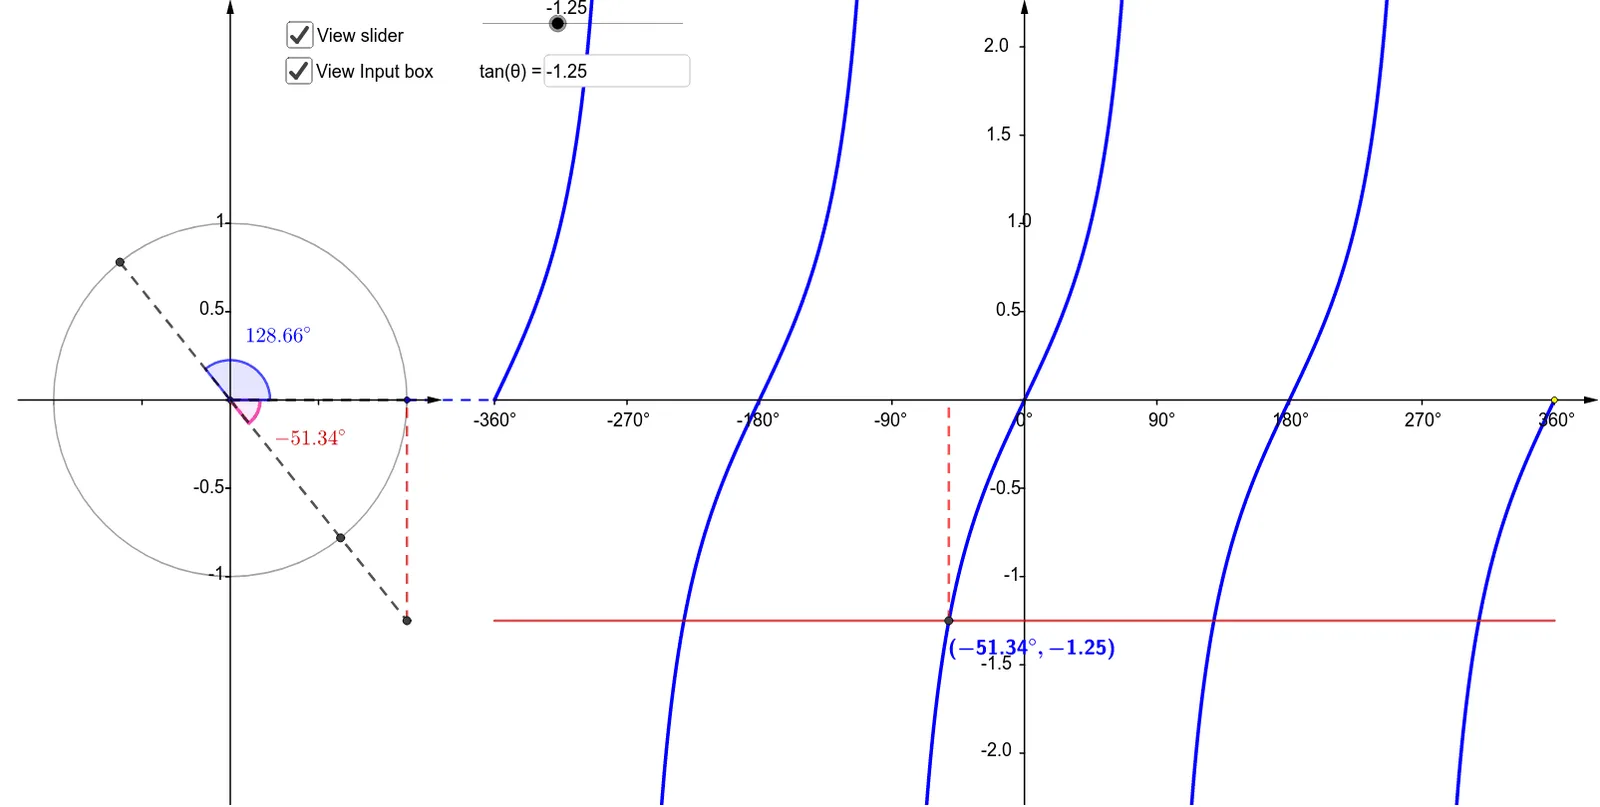
This example demonstrates the characteristics of the tangent function in different quadrants. It involves core trigonometric concepts and uses GeoGebra commands such as Point, Vector, Circle, etc., to show the changes of the tangent function in each quadrant. Suitable for high school math education and learning, helping students understand the periodicity and odd-even properties of the tangent function.
GeoGebra Commands & Parameters
Point(Ray[(0, 0), (-1, 0)]) → BVector((x(B), y(Corner[1])), (x(B), y(Corner[4]))) → uVector(B - (1.2, 0), B + (1.2, 0)) → vCircle(B, A) → cVector((0, y(Corner[1])), (0, y(Corner[4]))) → wVector((0 - x(Q), 0), (x(Corner[2]), 0)) → zSequence(Segment[((0.75 * i), 0), ((0.75 * i), -0.025)], i, -4, 4) → list1Sequence(Segment[(x(B), (0.5 * i) - 1), (x(B) - 0.025, (0.5 * i) - 1)], i, 0, 4) → list3Sequence(Segment[B + ((0.5 * i) - 1, 0), B + ((0.5 * i) - 1, -0.025)], i, 0, 4) → list4Segment(A, ((-x(Q)), 0)) → dTextfield(atantheta) → InputBox1Segment(P, (x(P), 0)) → rSegment(D, A) → jAngle(A, B, D) → βSequence(Segment[(0, (0.5 * i) - 1), (-0.025, (0.5 * i) - 1)], i, -2, 6) → list2Segment(B, D) → iSegment(B, A) → kIntersect(c, i) → C,Rotate(C, π, B) → C'Segment(C', B) → lAngle(A, B, C') → γ