
Kinematics s(t), v(t), a(t) Relationship Demo
Loading the math board and drawing, please wait…
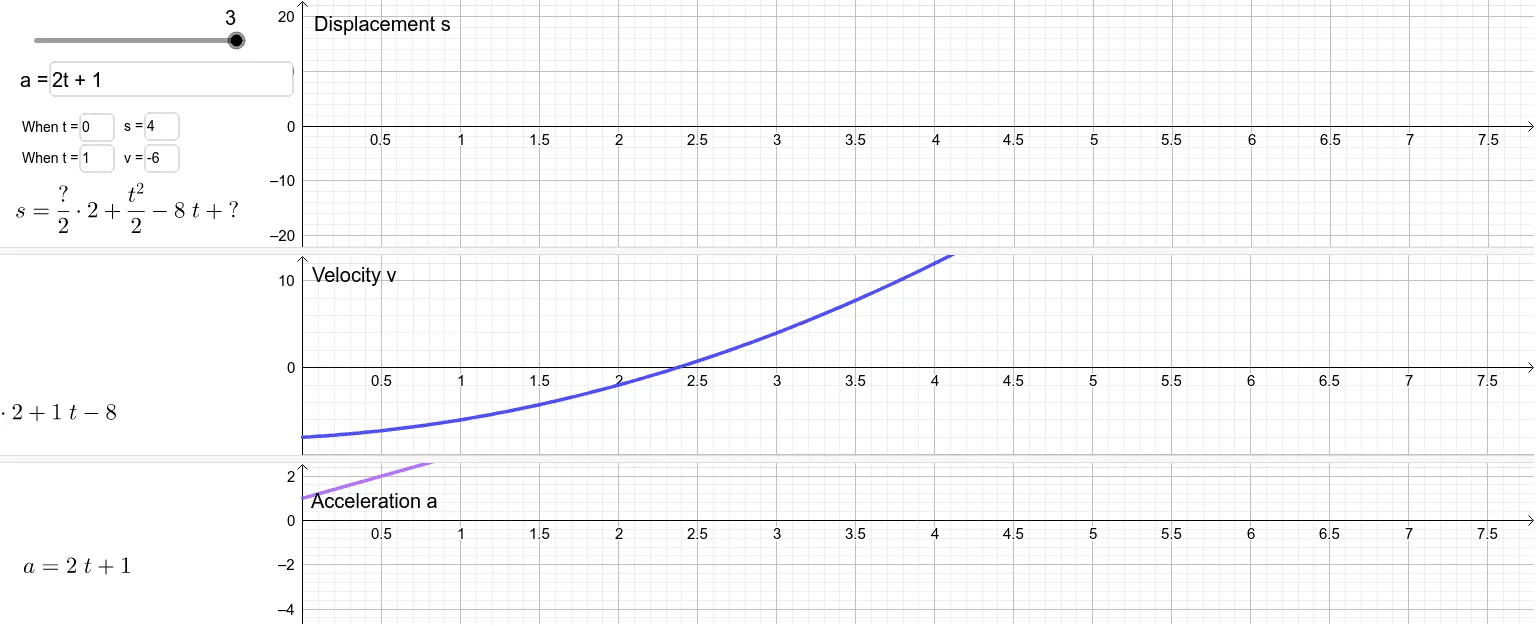
This example demonstrates the relationship between position function s(t), velocity function v(t), and acceleration function a(t) in kinematics; Core math concepts include derivatives, integrals, and function graphing in calculus; Construction highlights: Integral command for integration, Textfield and Corner commands for text fields, Slider Animation for sliders, and Locus for trajectory plotting; Suitable for high school and above students learning kinematics and calculus, ideal for physics teaching and mathematical visualization.
GeoGebra Commands & Parameters
Integral(a3, t) → v3Textfield(s1) → InputBox1Textfield(v2) → InputBox2Integral(v2, t) → s2Integral(v30, t) → s3Textfield(a3) → InputBox3Textfield(t_0) → InputBox4Textfield(s_0) → InputBox5Textfield(t_{00}) → InputBox6Textfield(v_{0}) → InputBox7Corner(1, 1) → C1Corner(1, 2) → C2
AI Drawing Prompt Reference
Create a graph demonstrating the relationship between position function s(t), velocity function v(t), and acceleration function a(t) in kinematics, highlighting derivatives and integrals. Start by plotting the acceleration function a(t), then integrate it to obtain v(t) and integrate v(t) to get s(t). Include text fields for function expressions and initial conditions, and use sliders and locus tools to illustrate dynamic changes.
The prompt above was compiled from the original drawing commands and is for reference only.