
Exponential and Logarithmic Functions (1)
Loading the math board and drawing, please wait…
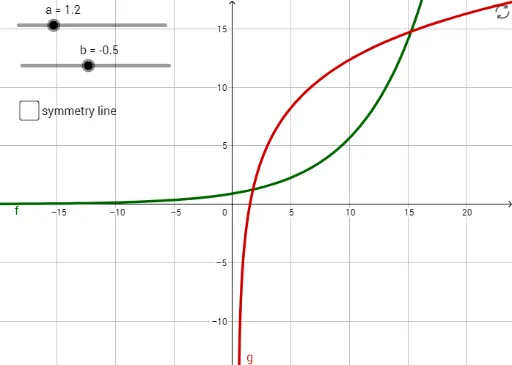
This example demonstrates the graphs of exponential and logarithmic functions and their transformation rules. Core math concepts include exponential functions, logarithmic functions, and function graph transformations. Construction highlights involve using GeoGebra commands/objects a, b, f, g, h, c to plot function graphs and adjust parameters. Suitable for high school mathematics teaching to understand function properties and graph transformations.
GeoGebra Commands & Parameters
Numeric a(1.2)Numeric b(-0.5)f(x) = a^(x + b)g(x) = log(a, x + b)y = x + bBoolean c(false)
AI Drawing Prompt Reference
Plot the graphs of exponential and logarithmic functions with parameters a=1.2 and b=-0.5, respectively, for y=a^(x+b) and y=log(a, x+b). Also, draw the line y=x+b. Set c to false to observe the function properties and graph transformations.
The prompt above was compiled from the original drawing commands and is for reference only.