
Explosives Simulation (1-prop z)
Loading the math board and drawing, please wait…
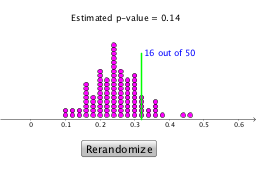
This example demonstrates the generation and visualization of random data following a normal distribution. Core math concepts include normal distribution, sequences, dot plots, line segments, and point creation. Construction highlights involve using GeoGebra commands like Sequence for sequences, DotPlot for dot plots, Segment for line segments, and Point for points, controlled by button1. The function f and point A are also utilized, with text1 and text2 for annotations. Suitable for high school and above students studying probability statistics and data analysis.
GeoGebra Commands & Parameters
Sequence(RandomBinomial[50, 0.25] / 50, n, 1, 100) → list1DotPlot(list1, false, 0.2) → list2Segment((0.32, 0), (0.32, 3)) → fPoint(f) → A
AI Drawing Prompt Reference
Create a dot plot of random data following a normal distribution. First, generate 100 random numbers from a binomial distribution. Then create a dot plot using these numbers. Next, draw a vertical segment at x=0.32 with a height of 3. Finally, create a point on this segment.
The prompt above was compiled from the original drawing commands and is for reference only.