
Comparing Mean and Median with Visual Distribution Models
Loading the math board and drawing, please wait…
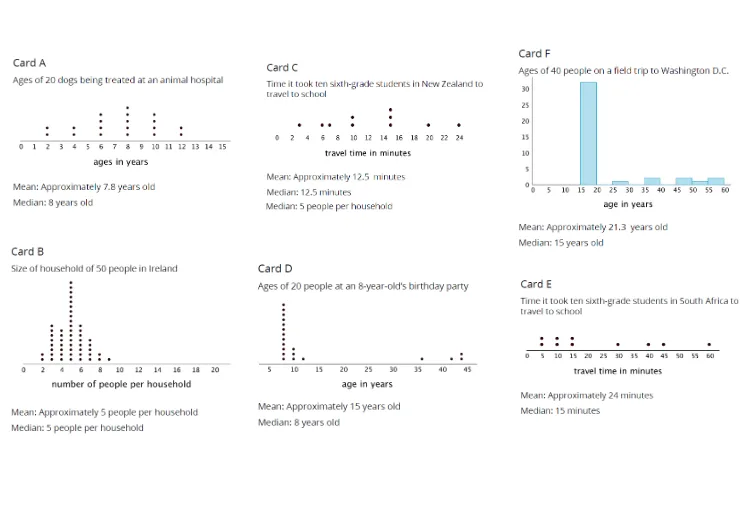
This GeoGebra example demonstrates, through visual constructions, how the mean and the median can differ as the shape of a data distribution changes. It highlights the idea of center of distribution and how skewness or outliers affect different summary statistics. The key math concepts include mean, median, and the robustness of median compared with mean under extreme values and distribution shifts. Construction-wise, the provided setup uses multiple interrelated objects (A, B, C, D, E, F, G, H, I, J, K, L) together with several picture/scene components (pic1–pic6) to present several comparative cases in one coordinated visualization. Each set supports illustrating where the mean-like and median-like central positions lie relative to the overall distribution. Suitable for late secondary school through early undergraduate courses in probability & statistics, especially for lessons on data summaries, skewness, and interpretive reasoning using graphical models.
GeoGebra Commands & Parameters
Point A(-12, 5)Point B(-7, 5)Point C(-12, 0)Point D(-7, 0)Point E(-6.333120517726799, 4.937539902926225)Point F(-1.3331205177268033, 4.937539902926225)Point G(-6.541320841306053, 0.104100161789626)Point H(-1.371076570059936, 0.10476174141682679)Point I(-0.7703411972432328, 4.1665602588634005)Point J(4.229658802756774, 4.1665602588634005)Point K(-0.6662410354536066, 0.2498403882951017)Point L(4.333758964546396, 0.2498403882951017)
AI Drawing Prompt Reference
Draw a graph showing the positions of the mean and median in a data distribution. The graph includes multiple points representing various positions in the data distribution. Points A and B are at y=5, points C and D at y=0. Points E and F are at y≈4.94, points G and H at y≈0.10, points I and J at y≈4.17, and points K and L at y≈0.25. These points can be used to draw a distribution plot to visually show the relationship between the mean and median. The graph should coordinate multiple comparison cases to illustrate how the shape of the data distribution affects the mean and median.
The prompt above was compiled from the original drawing commands and is for reference only.