
Exploring the Square Root Function (NS1-05-XT1)
Loading the math board and drawing, please wait…
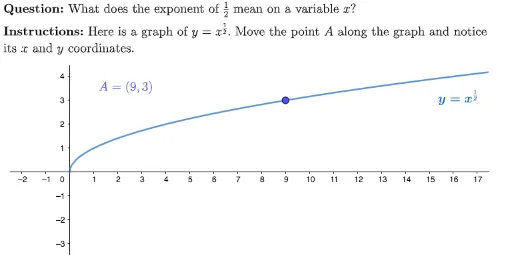
This GeoGebra example dynamically illustrates the graph of the square root function y=√x and its key points, enabling learners to intuitively understand the domain, range, and monotonic increasing behavior of the function. Core mathematical concepts include function graphing, square root operations, coordinates of points, and function notation. Construction highlights: the Sequence command generates a series of points, Point marks specific points, and LaTeX renders function expressions and labels; objects include background, function f, points set, point A, point label, main instructions, special instructions, and function label. Suitable for upper middle school or high school students as an introductory function exploration, and for teachers to demonstrate in class by dragging points or observing the point sequence to investigate properties of the square root function.
GeoGebra Commands & Parameters
Sequence((i, i^(1 / 2)), i, 0, 17) → pointsPoint(points) → ALaTeX("\text{\textbf{Question: }What does the exponent of \(\tfrac{1}{2}\) mean on a variable \(x\)?") → MainInstrucLaTeX("\text{\textbf{Instructions: }Here is a graph of \(y=x^{\frac{1}{2}}\). Move the point \(A\) along the graph and notice\\its \(x\) and \(y\) coordinates.") → SpecInstrucLaTeX(f) → functionLabel
AI Drawing Prompt Reference
Graph the square root function y = √x; plot a sequence of points for integer x from 0 to 17 with their corresponding y-values along the curve; include a draggable point on the curve that displays its x and y coordinates in real time; label the function with mathematical notation and add instructional text for the learner.
The prompt above was compiled from the original drawing commands and is for reference only.