
Exploring the Product Rule (Activity 12 HL)
Loading the math board and drawing, please wait…
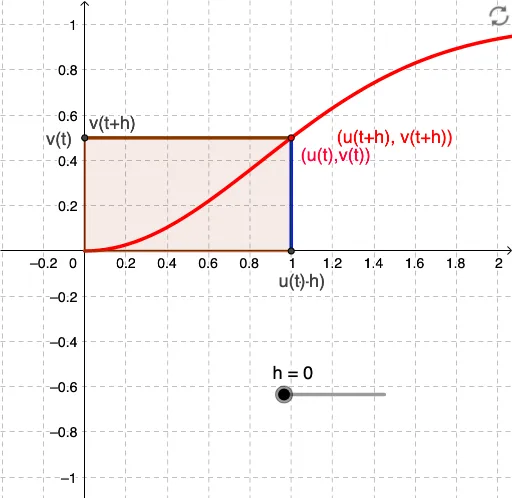
This example dynamically demonstrates the Product Rule in differential calculus, visually showing how the derivative of a product of two functions equals the sum of the product of each function's derivative with the other function. Core math concepts include the Product Rule and derivative calculations in calculus. Construction highlights from the GeoGebra command summary involve commands like CurveCartesian for plotting curves, OrthogonalLine for creating perpendicular lines, Intersect for finding intersections, Polygon for forming polygons, Segment for drawing segments, and Point for marking points. Suitable for advanced mathematics learners and educators teaching the Product Rule, parameterized equations, and dynamic geometric demonstrations.
GeoGebra Commands & Parameters
CurveCartesian(u(t), v(t), t, 0, 10) → aOrthogonalLine(A, xAxis) → bOrthogonalLine(A, yAxis) → cOrthogonalLine(B, xAxis) → dOrthogonalLine(B, yAxis) → eIntersect(b, e) → CIntersect(c, d) → DIntersect(d, xAxis) → EIntersect(b, xAxis) → FIntersect(e, yAxis) → GIntersect(c, yAxis) → HIntersect(yAxis, xAxis) → IPolygon(G, H, A, C) → poly1, f, g, i, jPolygon(F, A, D, E) → poly2, k, l, m, nPolygon(H, A, F, E, B, G) → poly3, h_1, a_1, f_1, e_1, b_1, g_1Segment(G, H) → pSegment(F, E) → qPoint(a) → JPolygon(H, A, F, J) → q1, h_2, a_2, f_2, j_1
AI Drawing Prompt Reference
Draw two function curves to demonstrate the product rule. Plot the curves, then draw perpendicular lines from points on the curves to the x-axis and y-axis, and find the intersections of these lines. Form multiple polygons using these intersection points and points on the curves to visualize the product rule, showing how the derivative of a product of two functions is the sum of the product of each function's derivative with the other function.
The prompt above was compiled from the original drawing commands and is for reference only.