
Interactive Normal Distribution Curve
Loading the math board and drawing, please wait…
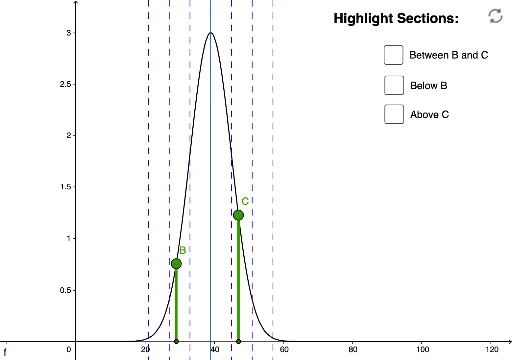
This example demonstrates the interactive properties of the Gaussian curve, covering core concepts like normal distribution, mean, standard deviation, amplitude, and integral calculations. It utilizes GeoGebra commands and objects such as Point, Segment, and Integral for construction, suitable for high school students and math enthusiasts in probability & statistics and calculus education.
GeoGebra Commands & Parameters
Point(f) → BPoint(f) → CSegment(P1, B) → lSegment(P2, C) → nIntegral(f, x(B), x(C)) → oIntegral(f, (-100 * s), x(B)) → pIntegral(f, x(C), (100 * s)) → q
AI Drawing Prompt Reference
Draw a normal distribution curve with two points on the curve, connect each point to an external point forming two line segments, and calculate the area enclosed by each segment and the curve, as well as the areas enclosed by the curve on both sides over a larger range adjustable by a slider, to demonstrate mean, standard deviation, and integral concepts of the normal distribution.
The prompt above was compiled from the original drawing commands and is for reference only.