
Standard Deviation & Calculus Example
Loading the math board and drawing, please wait…
In collections
Confirmed Coronavirus Cases in Countries
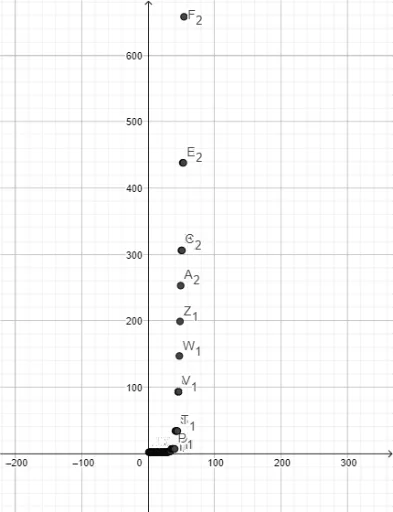
This example demonstrates how to construct dynamic graphics for standard deviation calculation and calculus applications using GeoGebra. The core math concepts involved include standard deviation, calculus, interest calculation, multiplication, and continuity. The construction highlights the use of objects like A1, B1, A2, B2, ..., A20, B20, showcasing dynamic changes through sliders and function graphs. Suitable for high school and above learners to understand practical applications of probability & statistics and calculus.
GeoGebra Commands & Parameters
122232425262728292102112122132142152162172182192202212222232242252262272282292302
AI Drawing Prompt Reference
Create a dynamic educational graphic illustrating standard deviation and calculus applications. Include a continuous function curve with a set of 20 data points scattered around it, showing variability. Add a slider to adjust the spread of these points, visually demonstrating changes in standard deviation. Below the curve, shade an area representing an integral or area calculation, and mark key intersection points. The layout should be clear, suitable for high school and above to understand the practical link between statistics and calculus.
The prompt above was compiled from the original drawing commands and is for reference only.