
Explore Rational Functions
Loading the math board and drawing, please wait…
In collections
Algebraic and transcendental functions
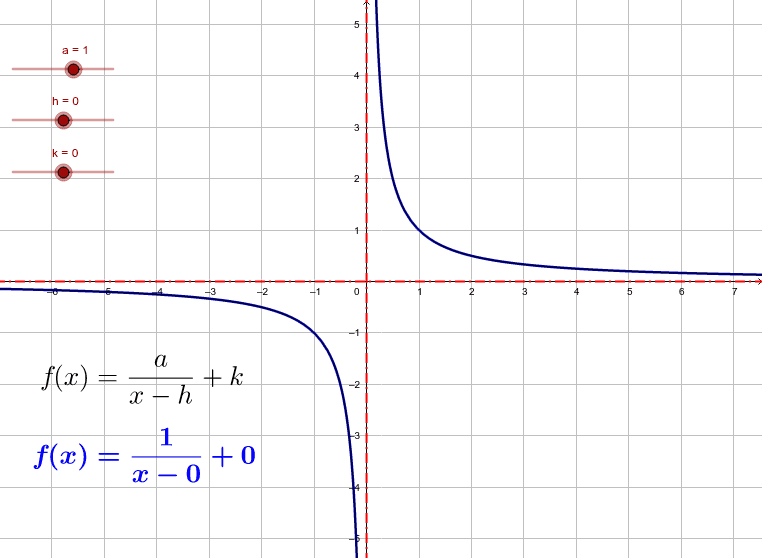
This example demonstrates how students can use GeoGebra to explore simple rational functions, focusing on their graphs, domains, asymptotes, and discontinuities. Key mathematical concepts include function definition, asymptotic behavior, and geometric transformations. The construction leverages GeoGebra commands/objects like a, h, A, B, k, f, b, c, g, text2, text1 to define parameters, plot functions, and annotate key features. Suitable for high school mathematics education to visually understand the geometric properties and variations of rational functions.
GeoGebra Commands & Parameters
Numeric a(1.0)Numeric h(0.0)Point A(6.34, 1.3381818181818186)Point B(5.539999999999999, 1.283636363636364)Numeric k(0.0)f(x) = (a * 1 / (x - h)) + ky = kx = hg(x) = 1 / x
AI Drawing Prompt Reference
Draw a simple rational function graph, showing its asymptotes with the x-axis and y-axis, and label key points, start with the basic function 1/x, then adjust the function shape by parameters a, h, k, and display the asymptote positions and key point coordinates.
The prompt above was compiled from the original drawing commands and is for reference only.