
Experimental Probability Spinner by Samantha Garcia
Loading the math board and drawing, please wait…
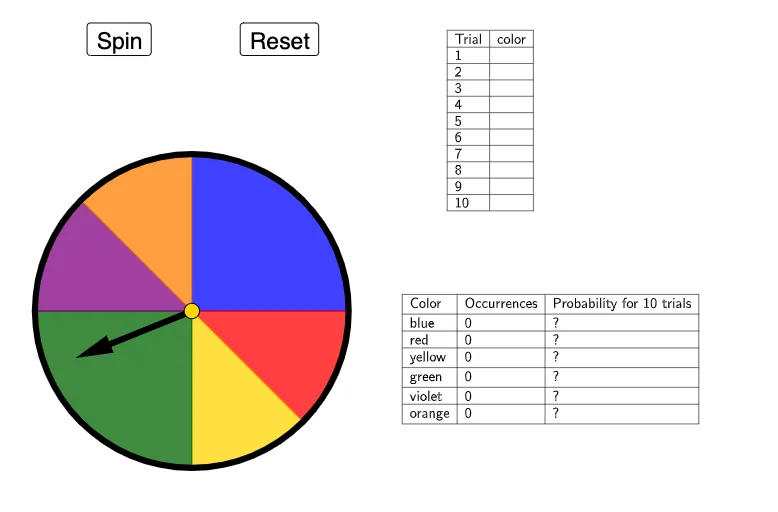
This example allows students to explore experimental probability and compare it with theoretical probability. It involves key concepts in probability and statistics, using commands like CountIf, Circle, Rotate, Vector, etc. Suitable for middle school and above students.
GeoGebra Commands & Parameters
CountIf(x ≟ "orange", B2:B11) → E7CountIf(x ≟ "violet", B2:B11) → E6CountIf(x ≟ "green", B2:B11) → E5CountIf(x ≟ "yellow", B2:B11) → E4CountIf(x ≟ "red", B2:B11) → E3CountIf(x ≟ "blue", B2:B11) → E2Circle(A, B) → cRotate(S0, (-(a°)), A) → CVector(A, C) → uLine(B, A) → bOrthogonalLine(A, b) → eIntersect(c, e) → D, ECircleSector(A, E, B) → fIntersect(c, b) → F, GMidpoint(G, E) → HLine(A, H) → gIntersect(c, g) → I, JCircleSector(A, J, E) → hCircleSector(A, G, J) → kCircleSector(A, D, G) → pCircleSector(A, I, D) → qCircleSector(A, B, I) → rIsInRegion(C, f) → iIsInRegion(C, h) → jSum(Sequence[(IsInRegion[C, Element[liste2, k]] * k), k, 1, 6]) → mElement(liste1, m) → texte1TableText({{A1, B1}, {A2, B2}, {A3, B3}, {A4, B4}, {A5, B5}, {A6, B6}, {A7, B7}, {A8, B8}, {A9, B9}, {A10, B10}, {A11, B11}}, "|_") → text1TableText({{D1, E1, F1}, {D2, E2, F2}, {D3, E3, F3}, {D4, E4, F4}, {D5, E5, F5}, {D6, E6, F6}, {D7, E7, F7}}, "|_") → text2
AI Drawing Prompt Reference
Draw a spinner with five color sectors: orange, violet, green, yellow, and red. The center is point A, and five sector areas are drawn around A, each corresponding to a color. Use slider a to rotate the spinner and get point C. Construct the spinner's edge lines and center lines through vectors and lines to form a complete spinner.
The prompt above was compiled from the original drawing commands and is for reference only.