
Explore Graphs of Exponential Functions
Loading the math board and drawing, please wait…
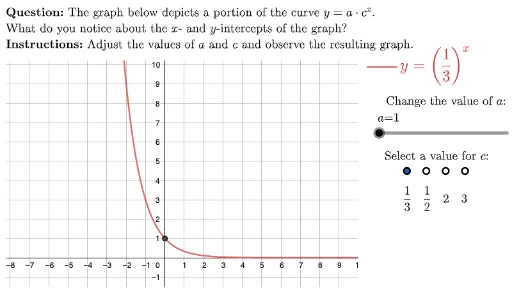
This example demonstrates the dynamic behavior of exponential function graphs as the base changes. Key math concepts include exponential functions, function graph transformations, and derivatives. GeoGebra commands like UnicodeToLetter, Polygon, TableText, LaTeX, Intersect, Sequence, Element, Segment are used, along with objects such as right, left, bottom, top, HowDidIDo, TryAnother, xmark, cmark, etc. It is suitable for high school and above students to understand exponential function properties and graphing techniques.
GeoGebra Commands & Parameters
UnicodeToLetter(10007) → xmarkUnicodeToLetter(10003) → cmarkPolygon({(left, bottom), (left, top), (right, top), (right, bottom)}) → viewboxTableText({rbDisplay}) → rbLabelsLaTeX(If[a ≟ 1, If[currBaseIndx < 3, (("y=\left(" * Element[rbDisplay, currBaseIndx]) * "\right)^x"), (("y= \vphantom{\dfrac{1}{1}^2}" * Element[rbDisplay, currBaseIndx]) * "^x")], (((("y= \vphantom{\dfrac{1}{1}^2}" * a) * "\left(") * Element[rbDisplay, currBaseIndx]) * "\right)^x")]) → eqnDispLaTeX("The graph below depicts a portion of the curve \(y=a\cdot c^x\).\\What do you notice about the \(x\)- and \(y\)-intercepts of the graph?") → MainInstrucLaTeX("Adjust the values of \(a\) and \(c\) and observe the resulting graph.") → SpecInstrucIntersect(f, yAxis, (0, 1)) → yInterceptSequence((11.5 + i, 4.5), i, 1, 4) → rbPointsElement(rbPoints, 1) → rb1Element(rbPoints, 2) → rb2Element(rbPoints, 3) → rb3Element(rbPoints, 4) → rb4Element(rbPoints, currBaseIndx) → currBaseLaTeX((((("\text{\textbf{Question: }" * MainInstruc) * "\\\textbf{Instructions: }") * SpecInstruc) * "}")) → allInstrucSegment(legendAnchor, legendAnchor + (1.5, 0)) → legendF