
Estimating Fractions on a Number Line with Error Visualization
Loading the math board and drawing, please wait…
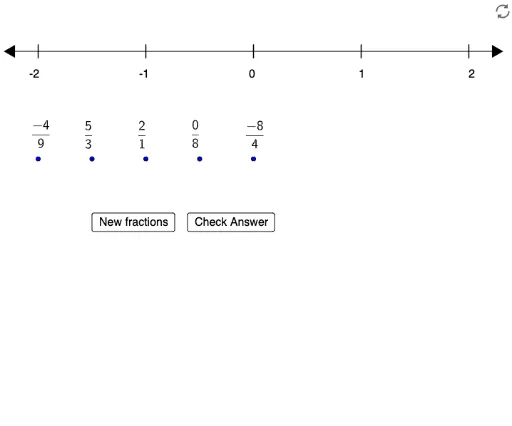
① This interactive GeoGebra example demonstrates how to estimate the positions of fractions on a number line, using dynamic buttons and visual feedback to show the estimation process and associated errors. ② Core mathematical concepts include fraction representation, correspondence between points and real numbers on a number line, estimation error calculation, and basic statistical ideas such as frequency and density. ③ Construction highlights: the example employs GeoGebra commands such as Sequence to generate ordered points, Segment for the number line, Element to access list items, Frequency to count occurrences, Max for maximum values, If for conditional logic, Circle and IsInRegion for region-based checks; key objects include list7, list6, dens, error, flist, H, G, F, E, D, A, B, f_1, C, list1, a, b, c, button1, p, I, J, K, L, M, button2, button3, text1–text5, N, O, list2, d, P, Q, R, with multiple buttons controlling interactions. ④ Suitable for upper elementary and middle school students learning fractions and number lines, as well as for teachers demonstrating estimation strategies and error analysis to foster number sense and statistical thinking.
GeoGebra Commands & Parameters
Sequence(RandomElement[dens], i, 1, 5) → list6_1Sequence(Element[list7, i] / Element[list6, i], i, 1, 5) → flistSegment(A, B) → f_1Sequence(Segment[(-2 + i, -0.12), (-2 + i, 0.12)], i, 0, 4, 1) → list1Sequence(Text[-2 + i, (x(C) + (1.02 * i), y(C))], i, 0, 4) → list2Sequence(Element[flist, i], i, 1, 5) → dElement(P, 1) → UElement(P, 2) → VElement(P, 3) → WElement(P, 4) → ZElement(P, 5) → A_1Sequence(Random[(-2 * Element[list6_1, i]), (2 * Element[list6_1, i])], i, 1, 5) → list7_1Frequency(l1) → l2Max(l2) → jIf(j ≠ 1, true, false) → kCircle(A_1, 0.1) → qCircle(Z, 0.1) → rCircle(U, 0.1) → sCircle(W, 0.1) → tCircle(V, 0.1) → c_1IsInRegion(H, q) → l_{3}IsInRegion(D, s) → mIsInRegion(E, c_1) → nIsInRegion(F, t) → oIsInRegion(G, r) → u
AI Drawing Prompt Reference
Draw a horizontal number line from -2 to 2, marking integer points. Generate five random points above the number line representing fractions. Use colored circles to indicate these fraction points, and connect two specific points on the number line with a line segment. Show whether each fraction point falls within certain regions using differently colored circles, and calculate the error for each point.
The prompt above was compiled from the original drawing commands and is for reference only.