
Epsilon-Delta Limit Definition Demo by Lenore Horner
Loading the math board and drawing, please wait…
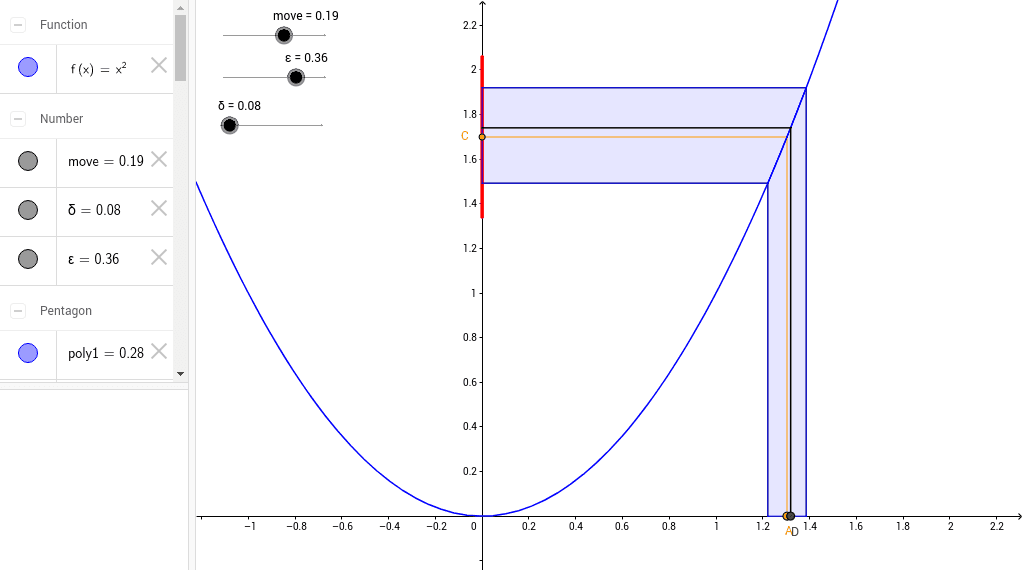
① This applet demonstrates the formal ε‑δ definition of a limit, dynamically showing how f(x) stays within an ε‑band when x approaches A by choosing an appropriate δ. ② Core mathematical concepts: limit, continuity, ε‑δ definition, function graphs. ③ Construction highlights: Point, Segment, and Polygon commands create points A, B, C and the ε, δ markers; polygons poly1 and poly2 represent vertical/horizontal bands; move and slider objects control ε and δ variations; key objects include f, ε, δ, A, B, C, poly1, poly2. ④ Suitable for high‑school pre‑calculus, introductory university calculus courses, and self‑study demonstrations.
GeoGebra Commands & Parameters
Point(xAxis) → ASegment(A, B) → aSegment(B, C) → bSegment(K, I) → dSegment(J, H) → eSegment(F, H) → gSegment(I, G) → hSegment(C - (0, ε), C + (0, ε)) → cPolygon(F, H, B, I, G) → poly1, f_1, h_1, b_1, i, g_1Polygon(K, I, B, H, J) → poly2, k, i_1, b_2, h_2, jSegment(D, E) → lSegment(E, L) → m
AI Drawing Prompt Reference
Draw a function graph demonstrating the epsilon-delta definition of a limit. Place a point on the x-axis as the limit point, with the curve nearby. Create two horizontal segments representing the epsilon band and two vertical segments for the delta band, forming a rectangle. Select two points on the curve, one on each side of the limit point, and connect them to the axes with segments, creating two polygons for the epsilon and delta regions. Add sliders to adjust epsilon and delta, and include a segment linking the function value to the limit point, visually showing that as x approaches the limit, f(x) stays within the epsilon band.
The prompt above was compiled from the original drawing commands and is for reference only.