
One-Sided Limit Tester: Explore Function Behavior from Left and Right
Loading the math board and drawing, please wait…
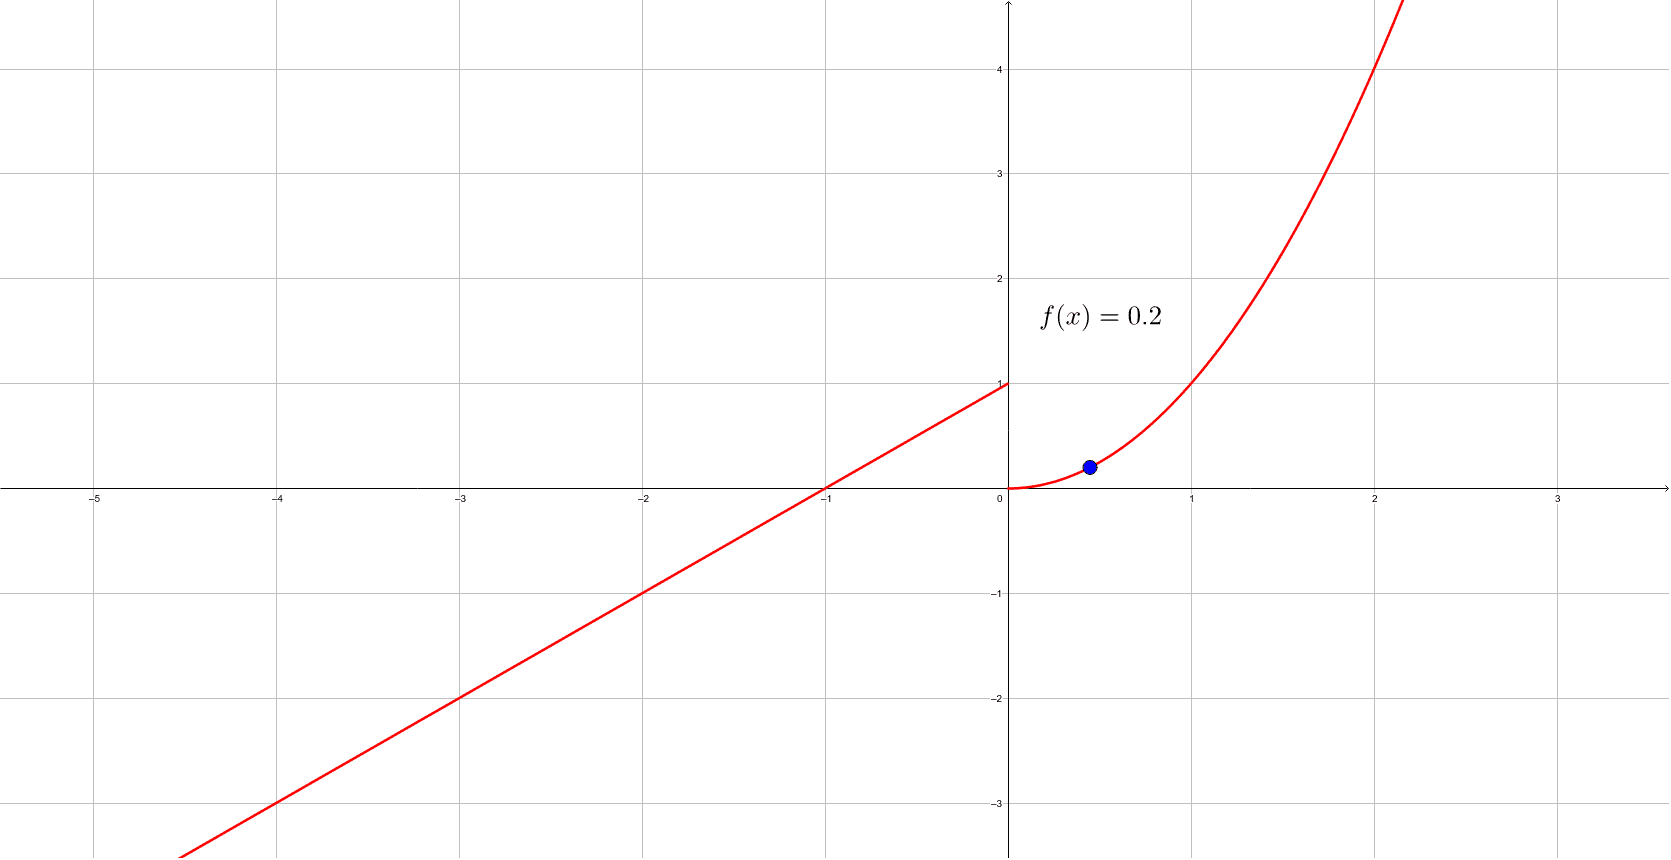
① This example demonstrates how dragging a blue point along the graph of a function f(x) reveals the values the function approaches as x tends to zero from the left or right, making one-sided limits visually intuitive. ② The core mathematical concept is the limit, specifically left-hand and right-hand limits, and the condition for a two-sided limit to exist. ③ Construction: using GeoGebra's Point command to create a draggable point A, linked to the function f and a text object text1 that displays the current function value, allowing dynamic exploration of the approach. ④ Suitable for high school or introductory college calculus students, ideal for classroom demonstrations or self-study to build a solid grasp of the intuitive meaning of limits.
GeoGebra Commands & Parameters
Point(f) → A
AI Drawing Prompt Reference
Draw a graph of a function with a draggable point on the curve. As the point moves along the curve toward x=0 from either the left or the right, display the corresponding y-value on the graph, making the one-sided limits visually clear. Include coordinate axes, the function curve, the movable point, and a dynamic label showing the current function value.
The prompt above was compiled from the original drawing commands and is for reference only.