
Envelope Matching Probability Simulation
Loading the math board and drawing, please wait…
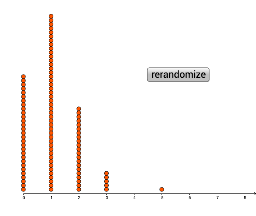
This example demonstrates the classic Envelope Matching Problem (Derangements), simulating the probability of matching letters to envelopes through random assignment. Core concepts include probability statistics, permutations, and derangement formulas. Construction utilizes Sequence to generate letter lists, Shuffle for randomization, If for matching logic, Sum to count matches, and DotPlot for distribution visualization. Suitable for high school mathematics classrooms or self-study in probability, offering an intuitive understanding of random events and limiting probabilities.
GeoGebra Commands & Parameters
Sequence(n, n, 1, 25) → letterShuffle(letter) → list1If(A2 ≟ B2, 1, 0) → C2If(A3 ≟ B3, 1, 0) → C3If(A4 ≟ B4, 1, 0) → C4If(A5 ≟ B5, 1, 0) → C5If(A6 ≟ B6, 1, 0) → C6If(A7 ≟ B7, 1, 0) → C7If(A8 ≟ B8, 1, 0) → C8If(A9 ≟ B9, 1, 0) → C9If(A10 ≟ B10, 1, 0) → C10If(A11 ≟ B11, 1, 0) → C11If(A12 ≟ B12, 1, 0) → C12If(A13 ≟ B13, 1, 0) → C13If(A14 ≟ B14, 1, 0) → C14If(A15 ≟ B15, 1, 0) → C15If(A16 ≟ B16, 1, 0) → C16If(A17 ≟ B17, 1, 0) → C17If(A18 ≟ B18, 1, 0) → C18If(A19 ≟ B19, 1, 0) → C19If(A20 ≟ B20, 1, 0) → C20If(A21 ≟ B21, 1, 0) → C21If(A22 ≟ B22, 1, 0) → C22If(A23 ≟ B23, 1, 0) → C23If(A24 ≟ B24, 1, 0) → C24If(A25 ≟ B25, 1, 0) → C25If(A26 ≟ B26, 1, 0) → C26Sum(C2:C26) → D2DotPlot(data, false, 0.2) → list2
AI Drawing Prompt Reference
Create a dot plot simulating the envelope matching problem. Generate a sequence of numbers from 1 to 25 representing letters, then randomly shuffle them to represent envelopes. For each position, compare the letter number with the envelope number; if they match, record 1, otherwise 0. Sum all matches to get the total number of correct matches for one trial. Repeat this process many times, and plot the distribution of match counts as dots on a graph, with the x-axis showing the number of matches (0 to 25) and the y-axis showing frequency or density, revealing the probability distribution of matching counts.
The prompt above was compiled from the original drawing commands and is for reference only.