
Electric Field Vectors: Superposition and Geometric Construction
Loading the math board and drawing, please wait…
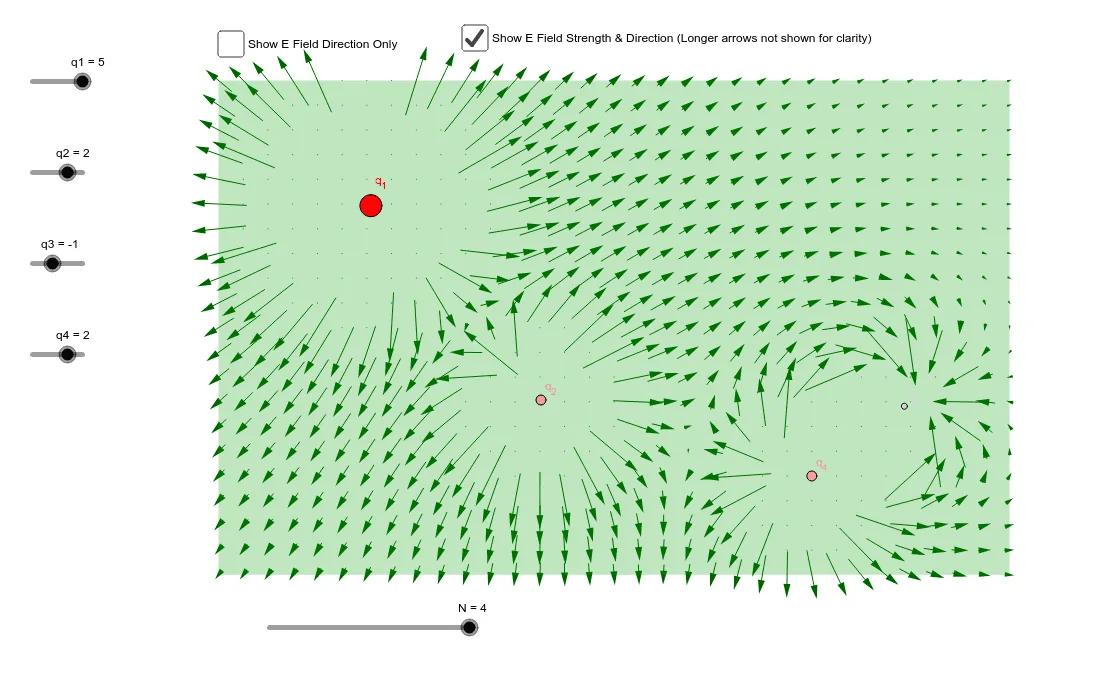
This GeoGebra example visualizes the electric field vector distribution generated by multiple point charges, demonstrating how field strength and direction vary across space. The core mathematical concepts include vector superposition, Coulomb's law in vector form, similar triangles used for vector decomposition, and sequence-based generation of a vector field. Construction highlights: commands such as Intersect, Point, Polygon, PointIn, and Sequence are used to build the geometric framework and sample points; charge objects q1 to q4 are defined, with intermediate variables E1x, E2x, etc., computing individual field components, then combined into total field components Ex and Ey, and finally displayed as vector E with controls Efx, Egy, and a button1 for interactive toggling. Suitable for high school or introductory university physics courses on electric fields, as well as mathematics lessons on vector operations and geometric construction, offering a cross-disciplinary approach to understanding vector field visualization.
GeoGebra Commands & Parameters
Intersect(xAxis, yAxis) → APoint(yAxis) → BPoint(xAxis) → DPolygon(A, B, C, D) → poly1, a, b, c, dPointIn(poly1) → P1PointIn(poly1) → P3PointIn(poly1) → P2PointIn(poly1) → P4Sequence(Sequence[Vector[(a, b) + ((Efx(a, b), Efy(a, b)) * 0.125), (a, b) - ((Efx(a, b), Efy(a, b)) * 0.125)], a, 0, 8, 0.25], b, 0, 5, 0.25) → list1Sequence(Sequence[Vector[(a, b) + ((Egx(a, b), Egy(a, b)) * 0.125), (a, b) - ((Egx(a, b), Egy(a, b)) * 0.125)], a, 0, 8, 0.25], b, 0, 5, 0.25) → list2
AI Drawing Prompt Reference
Draw a vector field representing the electric field from multiple point charges. Start with coordinate axes and construct a quadrilateral region by selecting points on the axes. Place four point charges at random positions inside this region. Then, sample many points on a uniform grid within the quadrilateral. For each sample point, compute the electric field components from each charge and sum them to get the total field vector. Finally, draw a short line segment centered at each sample point, with length proportional to field strength and direction indicating field orientation, creating a complete vector field visualization.
The prompt above was compiled from the original drawing commands and is for reference only.