
Calculus Big Picture: Slope and Area Connection
Loading the math board and drawing, please wait…
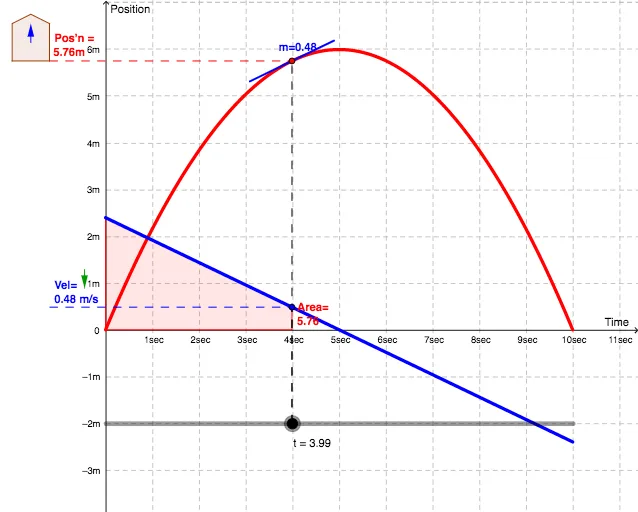
This example demonstrates the connection between slope and area, visually representing how the area under a function's curve relates to the slope of its tangent lines. Core math concepts include derivatives, integrals, vectors, and coordinate geometry. Constructed using GeoGebra commands like Polygon, Segment, Tangent, Circle, Intersect, Integral, and Vector. Ideal for high school and above students learning calculus or for educational presentations.
GeoGebra Commands & Parameters
Polygon(A, B, C, D, E) → poly1, a, b, c, d, eSegment(E, (t, p(t))) → psegTangent(Ppt, p) → tlineCircle(Ppt, 1) → PcirIntersect(Pcir, tline) → CP1, CP2Segment(CP1, CP2) → msegIntegral(v, 0, t) → AvelSegment((x(E), v(t)), (t, v(t))) → VsegVector((x(C), (0.5 * (y(A) + y(B)))), (x(C), (0.5 * (y(A) + y(B))) + (0.4 * sgn(v(t))))) → VvecSegment((t, -2), (t, p(t))) → ptsegSegment((t, -2), (t, v(t))) → vtsegVector((-0.45, v(t) + 0.6 - (0.2 * sgn(acc(t)))), (-0.45, v(t) + 0.6 + (0.2 * sgn(acc(t))))) → Cvec
AI Drawing Prompt Reference
Draw a function curve and show the connection between the area under the curve and the slopes of its tangent lines. Create multiple tangent lines at various points on the curve, connect their intersection points with the x-axis to form a polygon representing the area under the curve. Also, draw vertical segments from the x-axis to each tangent line, and include vectors indicating velocity and acceleration to illustrate their relationships.
The prompt above was compiled from the original drawing commands and is for reference only.