
Effect of Second Differences
Loading the math board and drawing, please wait…
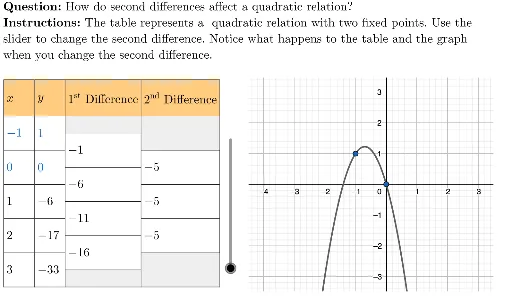
This example demonstrates the geometric significance of quadratic function graphs and their second differences. Core math concepts include quadratic equations, translation, special points, fractions, circumcircle, and power functions. It uses GeoGebra commands like FitPoly for function fitting, LaTeX for text rendering, and Polygon for constructing shapes. Suitable for high school students learning function properties and sequence difference concepts, ideal for classroom demonstrations.
GeoGebra Commands & Parameters
FitPoly(pointsToGraph, 2) → fLaTeX("\textbf{Question: }How do second differences affect a quadratic relation?") → QUESTIONLaTeX("\textbf{Instructions: }The table represents a quadratic relation with two fixed points. Use the\\slider to change the second difference. Notice what happens to the table and the graph\\when you change the second difference.") → INSTRUCTIONSPolygon({(-4.5, -3.5), (-4.5, 3.5), (3.5, 3.5), (3.5, -3.5)}) → viewBox
AI Drawing Prompt Reference
Draw a geometric illustration showing the effect of second differences on quadratic function graphs, including a table and a slider to change the second difference and observe the changes in the table and graph. The image should have a bounding box rectangle and display a question and instructions in LaTeX format nearby, explaining how to use the slider to modify the second difference and observe the effects on the graph.
The prompt above was compiled from the original drawing commands and is for reference only.