
Earth's Grid System
Loading the math board and drawing, please wait…
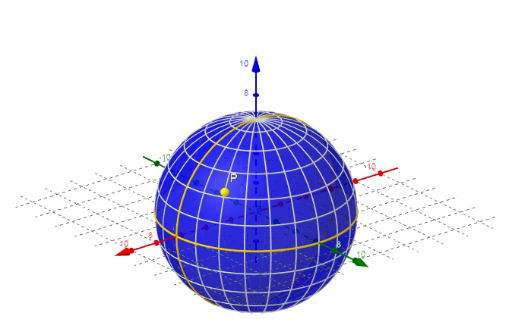
This example demonstrates the construction and visualization of the Earth's grid system, involving core mathematical concepts like coordinates, unit circle, symmetry, expected value, and linear functions. It utilizes commands such as Sphere, Sequence, and IntersectPath to create the grid. Suitable for high school mathematics education, illustrating applications of spatial geometry and analytical geometry.
GeoGebra Commands & Parameters
Sphere(M, r) → aSequence(Circle[(0, 0, 0), r, Rotate[xAxis, α]], α, 0°, 360°, 15°) → Liste2Sequence(Circle[(0, 0, (r * sin(α))), (r * cos(α)), zAxis], α, (-(90°)), 90°, 15°) → Liste1IntersectPath(xOyPlane, a) → cIntersectPath(b, a) → d
AI Drawing Prompt Reference
Draw the Earth's grid system, including a central sphere and two sets of concentric circles rotating around the x-axis and z-axis respectively to form a latitude and longitude grid, with intersection lines with the xy-plane visible, demonstrating applications of coordinate geometry, solid geometry, and trigonometry.
The prompt above was compiled from the original drawing commands and is for reference only.