
Dynamic Visualization of Volumes of Revolution
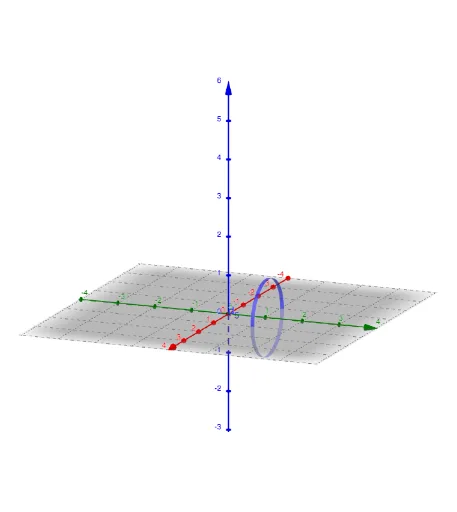
Loading the math board and drawing, please wait…
This GeoGebra example dynamically demonstrates how a plane region rotated about an axis forms a solid of revolution and how its volume is computed. The core mathematical concept is the application of definite integrals in geometry, where the total volume is obtained by integrating infinitesimally thin disks or cylindrical shells. Construction highlights include using the Integral command to compute cross-sectional areas, Circle and Cylinder to build the rotating cross-sections and solid model, RectangleSum for numerical approximation, and Slider/InputBox to adjust parameters with Textfield displaying results. Suitable for high school to early college students learning integral calculus, and useful for teachers in classroom demonstrations or for students to explore how different functions affect the volume of the resulting solid.
GeoGebra Commands & Parameters
Integral(g, 0, 6) → jTextfield(g) → inputBox1Circle((0, -1 + Value_x + Increment, 0), g(Value_x), y + (0 * z) = 0) → pIntegral(g, x) → qRectangleSum(g, a, b, Sections, 1) → iRectangleSum(h, a, b, Sections, 1) → lSegment((Value_x, 0), D) → sIntersect(xAxis, yAxis) → FCircle(F, E) → d_1Cylinder((0, Value_x, 0), (0, Value_x + Increment, 0), g(Value_x)) → d_4, d_3, d_4, d_5
AI Drawing Prompt Reference
Create a 3D coordinate system showing a solid of revolution formed by rotating a plane region about an axis. Display a function curve above the x-axis, with semi-transparent cross-sections beneath it. Place multiple circular disks along the curve and generate a cylinder representing the volume. Include a slider and input box to adjust function parameters and section count. Use rectangular bars to approximate the integral area, and show the computed volume as text. Emphasize dynamic visualization for educational demonstration.
The prompt above was compiled from the original drawing commands and is for reference only.