
Dynamic Illustration of Domain & Range from Graph Inspection
Loading the math board and drawing, please wait…
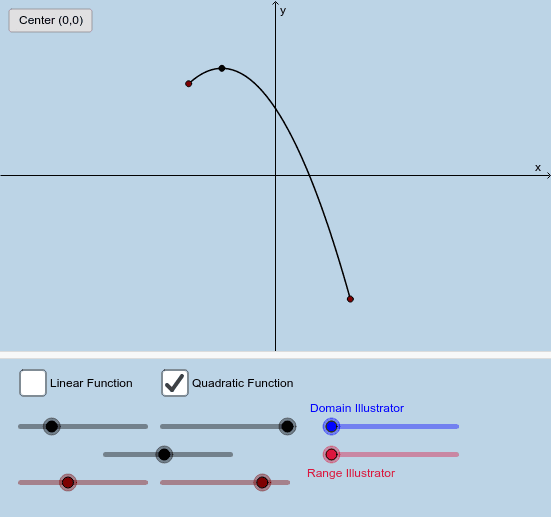
This example dynamically illustrates how to determine the domain and range of functions by inspecting their graphs. It covers core concepts like function graphs, linear and quadratic functions, sine functions, etc. Construction highlights include OrthogonalLine, Intersect, Dilate, Vector, Segment, and Line commands. Suitable for high school mathematics teaching on function properties.
GeoGebra Commands & Parameters
OrthogonalLine(B, i) → kOrthogonalLine(A, i) → jIntersect(i, j) → CIntersect(i, k) → DOrthogonalLine(B, yAxis) → lOrthogonalLine(A, yAxis) → mIntersect(l, yAxis) → EIntersect(m, yAxis) → FDilate(A, If[0 < e ≤ 1, 1 - e, 0], C) → A'Dilate(B, If[0 < e ≤ 1, 1 - e, 0], D) → B'Vector(A, A') → uVector(B, B') → vDilate(C, If[1 < e ≤ 2, 2 - e, 0], D) → C'Segment(C, C') → nDilate(A, If[0 < f ≤ 1, 1 - f, 0], F) → A'_1Dilate(B, If[0 < f ≤ 1, 1 - f, 0], E) → B'_1Vector(A, A'_1) → wVector(B, B'_1) → pDilate(F, If[1 < f ≤ 2, 2 - f, 0], E) → F'Segment(F, F') → qIntersect(g, t, 1) → GIntersect(g, g_1, 1) → IIntersect(i, t) → JIntersect(i, g_1) → KDilate(G, If[0 < a_1 ≤ 1, 1 - a_1, 0], J) → G'Dilate(I, If[0 < a_1 ≤ 1, 1 - a_1, 0], K) → I'Vector(G, G') → u_1Vector(I, I') → v_1Dilate(J, If[1 < a_1 ≤ 2, 2 - a_1, 0], K) → J'Segment(J, J') → i_1Line(H, i) → j_1Line(G, i) → k_1Line(I, i) → l_1Intersect(k_1, yAxis) → LIntersect(j_1, yAxis) → MIntersect(l_1, yAxis) → NDilate(H, If[0 < b_1 ≤ 1, 1 - b_1, 0], M) → H'Dilate(G, If[0 < b_1 ≤ 1, 1 - b_1, 0], L) → G'_1Dilate(I, If[0 < b_1 ≤ 1, 1 - b_1, 0], N) → I'_1Vector(I, I'_1) → w_1Vector(G, G'_1) → c_1Vector(H, H') → d_1Dilate(M, If[1 < b_1 ≤ 2, 2 - b_1, 0], N) → M'Segment(M, M') → m_1Dilate(M, If[1 < b_1 ≤ 2, 2 - b_1, 0], L) → M'_1Segment(M, M'_1) → p_1
AI Drawing Prompt Reference
Create a dynamic illustration showing how to determine the domain and range of functions by inspecting their graphs. Include images of linear, quadratic, and sine functions, with orthogonal lines, intersection points, vectors, segments, and sliders to dynamically demonstrate key features and transformations of function graphs, suitable for high school mathematics teaching.
The prompt above was compiled from the original drawing commands and is for reference only.