
Dynamic Demonstration of Set Union and Intersection
Loading the math board and drawing, please wait…
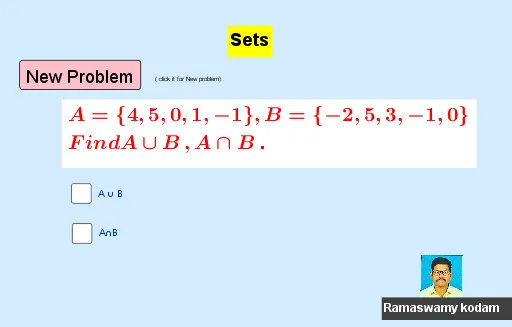
This GeoGebra example demonstrates the union and intersection of two sets, A and B, providing a visual representation of set membership and overlapping regions. Core mathematical concepts include set theory, union, intersection, elements, subsets, and the relationships between sets. The construction uses GeoGebra commands Sample and Sort to sample and order set elements, with objects such as points A, B, C, D, lists l1 and l2, text labels text1 through text6, a button button1 for interactivity, and an image object pic1. It is suitable for middle school and high school mathematics instruction, classroom demonstrations, and independent student exploration of set operations.
GeoGebra Commands & Parameters
Sample(Sequence[8] - 3, 5, false) → ASample(Sequence[8] - 3, 5, false) → BSort(Intersection[A, B]) → l1Sort(Union[A, B]) → l2
AI Drawing Prompt Reference
Create a single scene illustrating the union and intersection of two sets, A and B. First generate two groups of points representing the elements of A and the elements of B, with the same number of sampled elements, plotted as separate membership sets. Then visually emphasize the intersection by collecting and arranging the elements that belong to both sets into one ordered list-like display. Next emphasize the union by collecting and arranging all elements that belong to at least one of the two sets into another ordered list-like display. Add text labels to indicate the union and intersection and the membership relationships, and include a button to support interactive or dynamic demonstration of the set operations.
The prompt above was compiled from the original drawing commands and is for reference only.