
Dynamic Coordinates Demo: Drag Polygon Vertices to See Live Coordinates
Loading the math board and drawing, please wait…
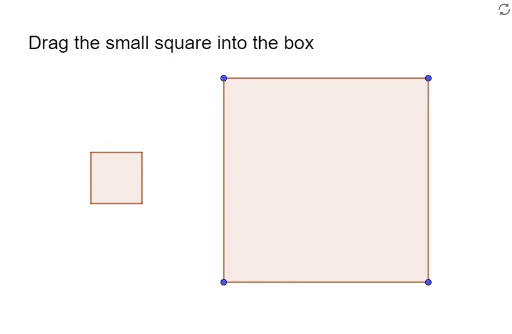
This GeoGebra example demonstrates the DynamicCoordinates feature by allowing users to drag the vertices of a polygon and observe their coordinates update in real time. It visually reinforces the relationship between points on a Cartesian plane and their coordinate pairs. Core mathematical concepts include the coordinate system, point representation, and polygon geometry. The construction uses the Polygon command to create the polygon and DynamicCoordinates to make vertex coordinates respond to dragging. Key objects include vertices F, E, D, C, A, B, sides q1, q2, b, c, d, e, f, g, h, and a text object (text1) displaying coordinates. Suitable for middle school and above, this interactive demo is ideal for introducing coordinate geometry, teaching dynamic transformations, or as a classroom tool to explore how dragging affects coordinates and shape properties.
GeoGebra Commands & Parameters
Polygon(C, D, E, F) → q2, c, d, e, f_1DynamicCoordinates(A, If[IsInRegion[A, q2], round(x(A)), x(A)], If[IsInRegion[A, q2], round(y(A)), y(A)]) → BPolygon(B, B + (1, 0), B + (1, 1), B + (0, 1)) → q1, b, f, g, h
AI Drawing Prompt Reference
Create an interactive coordinate demo: draw a draggable quadrilateral with four vertices. Place a draggable point inside it, and display its live coordinates in a text label. When the point is inside the quadrilateral, round its coordinates to integers. Then, using that point as the bottom-left corner, construct a unit square that moves with the point. This visualizes the connection between point positions and coordinate values.
The prompt above was compiled from the original drawing commands and is for reference only.