
Dynamic Colors: Sphere Covered With Colored Tracing Curves
Loading the math board and drawing, please wait…
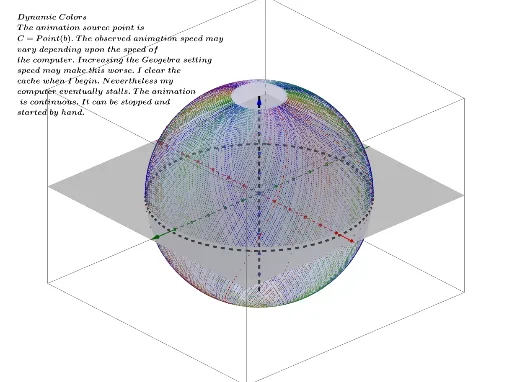
This example demonstrates a dynamic visualization of a sphere covered with colored tracing curves. Key math concepts include sphere, rotation, tangent function, parametric curves, and locus. Construction highlights from the summary involve GeoGebra commands/objects like CurveCartesian, Point, Rotate, Line, and Circle. Suitable for high school and above students studying solid geometry, parametric equations, and dynamic geometry, or for educational demonstrations.
GeoGebra Commands & Parameters
CurveCartesian((sin(a) * cos(a / 2)), (sin(a) * sin(a / 2)), cos(a), a, 0, (4 * π)) → bPoint(b) → CRotate(b, arg(C), zAxis) → cPoint(zAxis) → BLine(B, A) → fCircle(f, C) → d