
Dolphin Chi-Square Simulation
Loading the math board and drawing, please wait…
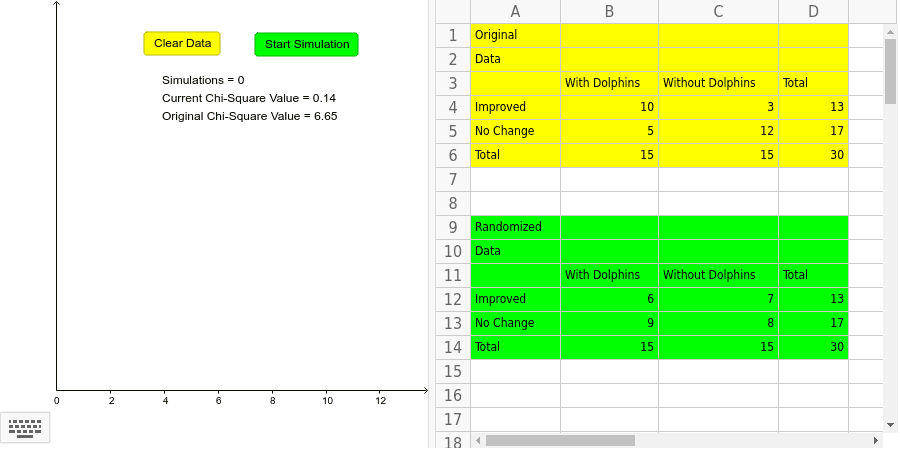
This example demonstrates a Dolphin Chi-Square simulation, focusing on the core concept of chi-square tests. Using GeoGebra commands such as Shuffle, Take, CountIf, etc., users can intuitively understand the principles of chi-square tests and their applications in data analysis. Suitable for high school and above students and teachers.
GeoGebra Commands & Parameters
Shuffle(results) → shuffledresultsTake(shuffledresults, 1, 15) → withdolphinsTake(shuffledresults, 16, 30) → withoutdolphinsCountIf(x ≟ "Improved", withdolphins) → withimprovedCountIf(x ≟ "Improved", withoutdolphins) → withoutimprovedCountIf(x ≟ "No Change", withdolphins) → withnochangeCountIf(x ≟ "No Change", withoutdolphins) → withoutnochangeElement(ChiSquaredTest[original], 2) → originalchisquareElement(ChiSquaredTest[randomized], 2) → randomizedchisquareCountIf(x > -1, Data) → aDotPlot(Data, false) → list1
AI Drawing Prompt Reference
Create a visualization for a dolphin therapy chi-square simulation. On the left, show a dot plot of the original data with the original chi-square statistic labeled below. On the right, display the randomized data: split 30 outcomes into two groups of 15 (with and without dolphins), count 'Improved' and 'No Change' in each group, and show these counts as a bar chart or table. Also display the randomized chi-square statistic. Arrange the layout to clearly compare observed vs. randomized results, emphasizing the concept of statistical significance.
The prompt above was compiled from the original drawing commands and is for reference only.