
Distances on a Logarithmic Scale
Loading the math board and drawing, please wait…
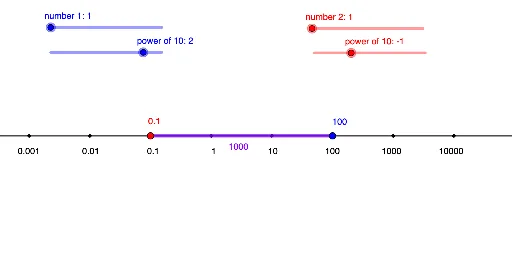
① This activity displays a logarithmic scale and lets the user define a number to visualize its position on the scale, then visualize the quotient of two numbers as a geometric distance. ② Core mathematical concepts include logarithms, logarithmic scaling, the relationship between ratios and distances, and the inverse nature of exponential and logarithmic functions. ③ Construction details: The GeoGebra commands Sequence and Segment are used to generate tick marks and connecting segments; objects include power1, power2 (power functions), number1, number2 (user inputs), g (logarithmic function graph), A, B (points), l1, l2 (scale lines), f (auxiliary function), and quotient (the ratio value). ④ Suitable for high school or introductory college students learning logarithms and exponents, also useful in statistics or data analysis to understand how multiplicative relationships become additive distances on a log scale.
GeoGebra Commands & Parameters
Sequence((n, 0), n, -3, 4) → l2Sequence(Text[10^(n), (n - abs(n) / 16, -0.3)], n, -3, 4) → l1Segment(B, A) → f
AI Drawing Prompt Reference
Draw a logarithmic scale where users can input two numbers to visualize their positions on the scale and the geometric distance representing their quotient. First, create a horizontal line segment with integer values from -3 to 4, then add labels for the logarithmic scale above it. Finally, draw a line segment connecting two points A and B to represent the quotient of the two numbers.
The prompt above was compiled from the original drawing commands and is for reference only.