
Different Views of the Same Fraction: Visualizing Fractions with Geometric Const
Loading the math board and drawing, please wait…
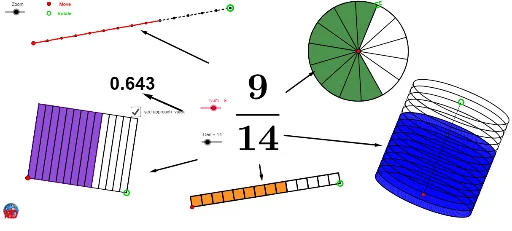
This GeoGebra example demonstrates multiple geometric representations of the same fraction, using circles, segments, polygons, and curves to illustrate the numerical value in various visual forms. The core mathematical concepts include equivalent fractions, proportional reasoning, and the connection between arithmetic and geometry. The construction employs commands such as Circle, Point, Segment, Intersect, OrthogonalLine, Ellipse, Sequence, CurveCartesian, Line, Polygon, Element, CircleSector, Take, and Vector, with objects like Den, D, Zoom, d_1, t, p, M, l, Q, n, N, O, b, C, q, J, k, B, f, A, e, a, Num, Tour, pic1, E, F, liste1, liste2, K, b_1, liste3, c, d, liste5, G, j, liste3b, g, and h. It uses sequences and lists to create dynamic visualizations. This resource is suitable for upper elementary to middle school students learning fractions, and for teachers creating interactive lessons to help students grasp different representations and equivalences of fractions.
GeoGebra Commands & Parameters
Circle(D, Zoom) → d_1Circle(D, (0.25 * Zoom)) → tCircle(D, (2 * Zoom)) → pPoint(p) → MSegment(D, M) → lIntersect(t, l) → Q,OrthogonalLine(D, l) → nIntersect(d_1, n) → N, OEllipse(N, O, Q) → bCircle(C, (2 * Zoom)) → qCircle(J, (3 * Zoom)) → kCircle(B, (4 * Zoom)) → fCircle(A, Zoom) → ePoint(e) → EPoint(f) → FSequence(Rotate[E, i, A], i, 0, 6.283185307179586, (2 * π / Den)) → liste1Sequence(Translate[B, Vector[(i * Vector[B, F])]], i, 0, 1, 1 / Den) → liste2Point(k) → KCurveCartesian(x(D) + (Zoom * cos(i)), y(D) + ((0.25 * Zoom) * sin(i)), i, 0, 6.28319) → b_1Sequence(Translate[J, Vector[(i * Vector[J, K])]], i, 0, 1, 1 / Den) → liste3Segment(B, F) → cCircle(A, E) → dSequence(Translate[b, Vector[(i * Vector[D, M])]], i, 0, 1, 1 / Den) → liste5Point(q) → GSegment(J, K) → jSequence(Polygon[Element[liste3, i], Element[liste3, i + 1], 4], i, 1, Length[liste3]) → liste3bSegment(C, G) → gOrthogonalLine(C, g) → hCircle(C, (1.5 * Zoom)) → sIntersect(s, h) → H, LLine(L, g) → iLine(G, h) → mIntersect(i, m) → IPolygon(C, G, I, L) → poly1, c_1, g_1, i_1, l_1Sequence(Translate[C, Vector[(i * Vector[C, G])]], i, 0, 1, 1 / Den) → liste4Sequence(Translate[L, Vector[(i * Vector[C, G])]], i, 0, 1, 1 / Den) → liste6Sequence(Segment[A, Element[liste1, i]], i, 1, Length[liste1]) → liste7Sequence(Segment[Element[liste4, i], Element[liste6, i]], i, 1, Length[liste6]) → liste8Element(liste1, Num + 1) → AACircleSector(A, E, AA) → e_1Element(liste2, Num + 1) → BBSegment(B, BB) → a_1Take(liste5, 1, Num + 1) → liste9Element(liste4, Num + 1) → CCElement(liste6, Num + 1) → LLPolygon(C, CC, LL, L) → poly2, c_2, cc, ll, l_2Take(liste3b, 1, Num) → liste10Line(M, n) → f_1Intersect(b, n) → P, RLine(R, l) → h_1Line(P, h_1) → j_1Intersect(f_1, h_1) → SIntersect(f_1, j_1) → TSegment(S, R) → k_1Segment(T, P) → m_1Vector(V, W) → uVector(Z, A_1) → vVector(B_1, C_1) → wVector(D_1, E_1) → zVector(F_1, G_1) → rCircle(D, pp) → p_1Intersect(p_1, l) → J_1,Sequence(Translate[b, Vector[(i * Vector[D, J_1])]], i, 0, 1, 0.01) → liste11Vector(K_1, L_1) → u_1
AI Drawing Prompt Reference
Draw a central circle with two concentric circles, one with a radius one-fourth the central circle and another twice as large. Connect the center to the outer circle with a line segment, intersecting the smaller circle at a point. Create an ellipse using this point and the center as foci. Then, draw multiple circles and ellipses, using rotation and translation to create dynamic visualizations. Finally, combine some shapes into polygons and connect them with lines to form intricate structures, illustrating how different geometric forms represent the same fraction.
The prompt above was compiled from the original drawing commands and is for reference only.