
Difference of Two Dice
Loading the math board and drawing, please wait…
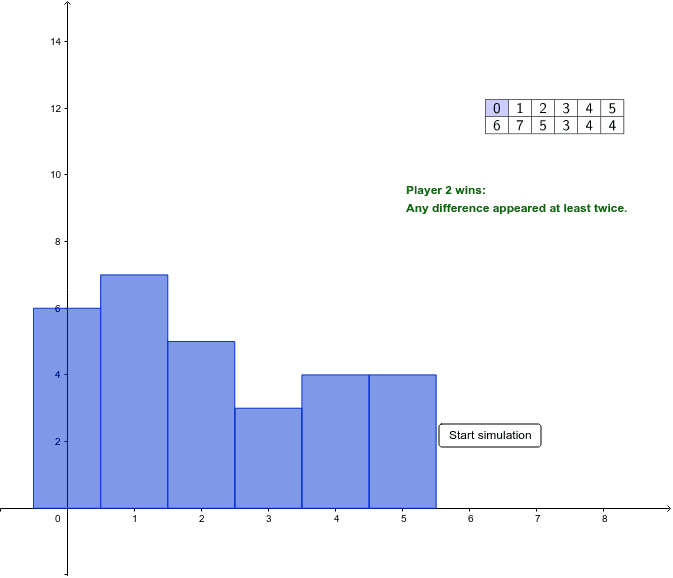
This example demonstrates the statistical distribution of the difference when rolling two dice twice. It involves core math concepts like Probability & Statistics. Constructed using GeoGebra commands/objects such as Sequence, CountIf, BarChart, TableText. Suitable for high school students learning probability statistics.
GeoGebra Commands & Parameters
Sequence(Random[1, 6], j, 1, k) → W1Sequence(Random[1, 6], j, 1, k) → W2Sequence(abs(Element[W1, j] - Element[W2, j]), j, 1, k) → DifferenzCountIf(x ≟ 0, First[Differenz, n]) → Anzahl0CountIf(x ≟ 1, First[Differenz, n]) → Anzahl1CountIf(x ≟ 2, First[Differenz, n]) → Anzahl2CountIf(x ≟ 3, First[Differenz, n]) → Anzahl3CountIf(x ≟ 4, First[Differenz, n]) → Anzahl4CountIf(x ≟ 5, First[Differenz, n]) → Anzahl5BarChart(A1:F1, A2:F2) → aTableText({{A1, B1, C1, D1, E1, F1}, {A2, B2, C2, D2, E2, F2}}, "|_") → Text1
AI Drawing Prompt Reference
Create a statistical distribution bar chart showing the frequency of differences when rolling two dice twice, by generating random numbers for dice rolls, calculating the absolute difference of each pair, counting occurrences of each difference, and displaying the results as bars, with a data table next to the chart.
The prompt above was compiled from the original drawing commands and is for reference only.