
Dice Roll Probability Distribution Simulation
Loading the math board and drawing, please wait…
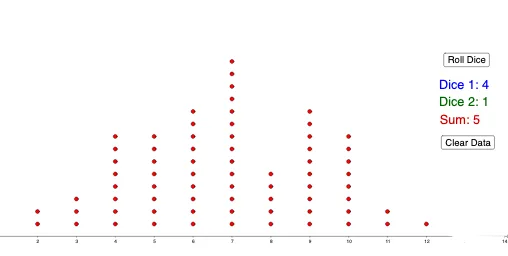
This GeoGebra example demonstrates the probability distribution simulation of rolling two dice and summing the results. Core mathematical concepts include: random variable probability distribution, frequency statistics, and the law of large numbers. Construction details: ①Use the Random command to generate random numbers simulating dice rolls; ②Use the Sequence command to generate multiple experiment sequences; ③Use CountIf to count frequencies of sums (2-12); ④Use Polygon to draw frequency distribution or data lists for results; ⑤Set up interactive buttons (button1, button2) to control simulation. Suitable for middle and high school mathematics probability and statistics teaching, demonstrating discrete random variable distributions and the relationship between frequency and probability.
GeoGebra Commands & Parameters
CountIf(x ≟ 2, data) → twoCountIf(x ≟ 3, data) → threeCountIf(x ≟ 6, data) → sixCountIf(x ≟ 5, data) → fiveCountIf(x ≟ 4, data) → fourCountIf(x ≟ 7, data) → sevenCountIf(x ≟ 8, data) → eightCountIf(x ≟ 9, data) → nineCountIf(x ≟ 10, data) → tenCountIf(x ≟ 11, data) → elevenCountIf(x ≟ 12, data) → twelveSequence((7, i), i, 1, seven) → list7Sequence((12, i), i, 1, twelve) → list12Sequence((11, i), i, 1, eleven) → list11Sequence((10, i), i, 1, ten) → list10Sequence((9, i), i, 1, nine) → list9Sequence((8, i), i, 1, eight) → list8Sequence((6, i), i, 1, six) → list6Sequence((5, i), i, 1, five) → list5Sequence((4, i), i, 1, four) → list4Sequence((3, i), i, 1, three) → list3Sequence((2, i), i, 1, two) → list2Random(1, 6) → bRandom(1, 6) → aPoint(xAxis) → CPolygon(A, B, C) → t1, c, a_1, b_1
AI Drawing Prompt Reference
Draw a probability distribution chart for the sum of two dice rolls. The horizontal axis shows possible sums from 2 to 12, and the vertical axis shows frequency counts. Represent each sum's frequency with vertical stacks of dots or short lines, forming a bar-like distribution. Include a slider to control the number of trials and two buttons to reroll or reset the statistics. Frequencies accumulate over many random trials, illustrating how empirical frequencies approach theoretical probabilities as trials increase.
The prompt above was compiled from the original drawing commands and is for reference only.