
Derivatives Introduction Demo
Loading the math board and drawing, please wait…
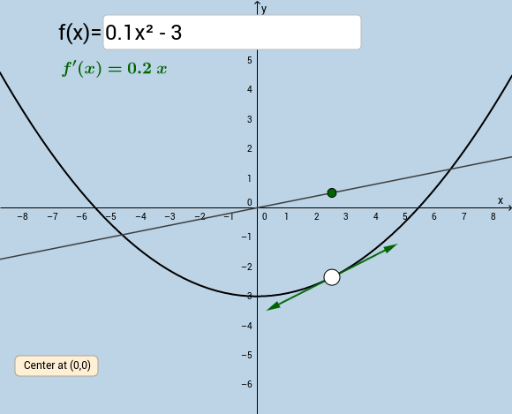
This example dynamically demonstrates the relationship between the graph of a function and its derivative function. It involves core math concepts like derivatives, function graphs, tangent functions, tangent lines, integers, angles, equations, and arithmetic operations. It is constructed using GeoGebra commands such as Tangent, Slope, Textfield, Intersect, Circle, and Vector, making it suitable for high school students learning calculus.
GeoGebra Commands & Parameters
Tangent(A, f) → gSlope(g) → mTextfield(f) → InputBox1Textfield(a) → InputBox2Intersect(f', h, (2.543895005807202, 0.5087790011614404)) → BIntersect(f', i, 1) → CCircle(A, 2.5) → cIntersect(c, g) → D, EVector(A, D) → uVector(A, E) → v
AI Drawing Prompt Reference
Draw the graph of a function and its derivative to show their relationship. Start by drawing the function graph, then draw the tangent line at a point on the graph and display its slope. Next, input a function expression and an integer in the text fields to find the tangent line at the corresponding point. Finally, draw a circle centered at the origin with a radius of 2.5, and find its intersections with the tangent lines to draw vectors from the origin to these intersection points.
The prompt above was compiled from the original drawing commands and is for reference only.