
Derivatives in Polar Coordinates
Loading the math board and drawing, please wait…
In collections
Polar Coordinates (Calculus 2)
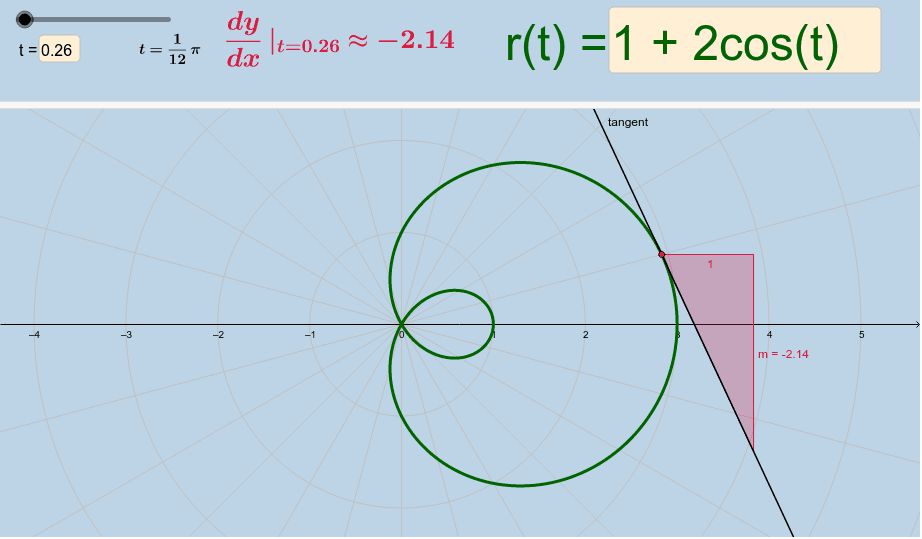
This example demonstrates the geometric meaning of the derivative, dy/dx, of a polar function by visualizing its graph. Key math concepts include polar coordinates, derivatives, tangent lines, secant lines, and slopes. GeoGebra commands like CurveCartesian, Sequence, and Tangent are used to construct the function graph, trajectories, and text displays. Suitable for high school and above mathematics learners or calculus instruction.
GeoGebra Commands & Parameters
CurveCartesian((r(t) * cos(t)), (r(t) * sin(t)), t, 0, 6.283185307179586) → aSequence(a(i), i, t, tmax, b) → list1Sequence(Segment[(0, 0), Element[list1, i]], i, 0, n) → list2Sequence(Polygon[(0, 0), Element[list1, i], Element[list1, i + 1]], i, 1, n) → list3Textfield(t) → InputBox1Textfield(tmax) → InputBox2Textfield(n) → InputBox3Textfield(r) → InputBox4Sequence(Segment[(0, 0), Element[list1, i]], i, 1, n) → list4FractionText(t / π) → text2FractionText(tmax / π) → text3Sum(list3, n) → cFractionText(d) → text5Element(list1, 1) → ATangent(A, a) → eSlope(e) → m
AI Drawing Prompt Reference
Draw a polar function graph using the given r(t) function, showing points at different t values and connecting them to form a curve. Draw line segments from the origin to points on the curve to show the trajectory. Use these segments to construct polygons, displaying the polar graph. Set input boxes for the range of t (tmax) and the number of points (n), as well as the polar function r. Draw a tangent line to show the direction of the tangent at t, and calculate and display the slope m of this tangent.
The prompt above was compiled from the original drawing commands and is for reference only.