
Derivative at Point (with Absolute Value)
Loading the math board and drawing, please wait…
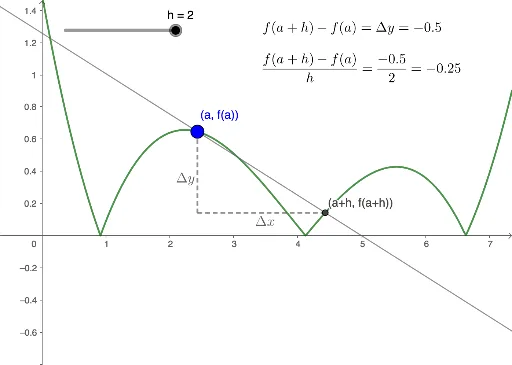
This example demonstrates graphing the derivative at a point involving an absolute value function. Key math concepts include derivatives, absolute value functions, tangent lines, secant lines, orthogonal lines, rectangles, and centroids. It uses GeoGebra commands like Point, Line, OrthogonalLine, Intersect, and Segment. Suitable for high school and above students learning calculus, function graphs, and geometric constructions.
GeoGebra Commands & Parameters
Point(f) → ALine(A, B) → gOrthogonalLine(A, xAxis) → iOrthogonalLine(B, yAxis) → jIntersect(i, j) → CSegment(A, C) → kSegment(C, B) → l
AI Drawing Prompt Reference
Draw a graph of an absolute value function and its tangent and normal lines at a point. First, pick a point A on the absolute value function and draw a horizontal line g through A. Then, draw a vertical line i through A and a horizontal line j through B, where i and j intersect at point C, the intersection of the normal and horizontal line. Finally, draw line segments k and l connecting A to C and C to B, respectively.
The prompt above was compiled from the original drawing commands and is for reference only.