
Demonstration of Upper and Lower Sums/Riemann Sum
Loading the math board and drawing, please wait…
In collections
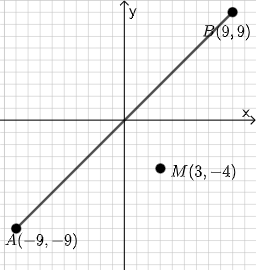
Open Middle: Distance and Midpoint Exercise
This example demonstrates how to dynamically construct upper and lower sums to approximate the Riemann sum, visually illustrating the geometric meaning of the integral concept. It involves core mathematical concepts such as upper sum, lower sum, Riemann sum, similar triangles, inequalities, and arithmetic mean. The construction uses GeoGebra commands and objects like PointIn, Segment, SurdText, Textfield, Point, Mode, Intersect, Polygon, Midpoint, If, Angle. It is suitable for high school calculus introduction, helping students understand the discrete approximation process of integration.
GeoGebra Commands & Parameters
PointIn(e) → APointIn(e) → BSegment(A, B) → fSurdText(f) → text1Textfield(j) → InputBox1Textfield(k) → InputBox2Point(Circle[A, sqrt((100 * j) + (10 * k) + o)]) → CSegment(A, C) → lMode(l1) → l2Intersect(eq1, p) → DPolygon(A, D, M) → t1, f_1, g_1, h_1Segment(A, D) → qSegment(D, B) → rTextfield(o) → InputBox3Midpoint(Segment[A, B]) → EIf(mcorrect, "√", "x") → text9Segment(A, M) → i_1Segment(D, M) → j_1Angle(M, D, A) → αSegment(A, D) → k_1Segment(A, M) → l_1Segment(M, B) → m_1If(Distance[A, C] < Distance[A, M], "Too short!", Distance[A, C] > Distance[A, M], "Too long!", "This value is correct!") → text7If(Length[l2] ≟ 0, "All digits are different.", "Some digits repeat.") → text8
AI Drawing Prompt Reference
Create a dynamic geometry illustration of upper and lower sums to approximate a Riemann sum. Start with two fixed interval endpoints and draw the segment between them. From the first endpoint, generate a third point on a circle whose radius is determined by three user-controlled numeric inputs; connect this point to the first endpoint to form the main boundary lines. Construct additional polygonal regions that represent the upper and lower sum areas, including lines passing through the interval midpoint. Add a marked angle at the midpoint with respect to the endpoint rays. Include on-canvas text feedback that reacts to whether a chosen length is too short/too long, and another text indicating whether the supplied digits satisfy the stated condition. The figure should update as the inputs change to visualize the inequality-based comparison of sums.
The prompt above was compiled from the original drawing commands and is for reference only.