
Demonstration of r Correlation Coefficient Sensitivity
Loading the math board and drawing, please wait…
In collections
Statistics Demonstrations
Statistics Demonstrations
Statistics Demonstrations
Statistics Demonstrations
Statistics Demonstrations
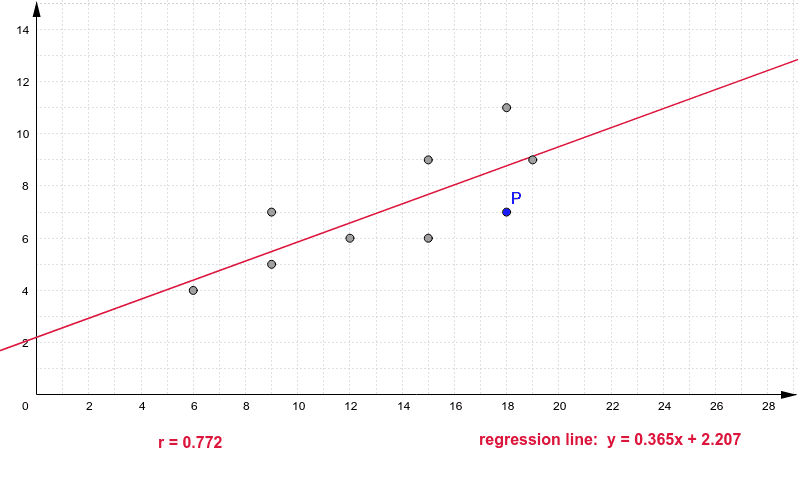
This example visualizes the sensitivity of the r correlation coefficient by showing how the linear regression line changes with varying data distributions. Key math concepts include correlation coefficient, linear regression, statistical distribution, and data sensitivity analysis. The construction uses the GeoGebra command FitLineY to fit a line through specified points (P_1 to P_9), generating the regression line regLine, and includes text objects text1 and text7 for explanation. Suitable for high school and above students learning statistical data analysis and regression sensitivity.
GeoGebra Commands & Parameters
FitLineY(C2:C7) → aFitLineY(pts) → regLine
AI Drawing Prompt Reference
Create a chart to demonstrate how the linear regression line changes with varying data distributions, highlighting the sensitivity of the correlation coefficient, including a fitted line and explanatory text, start by plotting nine data points, then fit a regression line through these points, and finally add text to explain the chart.
The prompt above was compiled from the original drawing commands and is for reference only.