
Create Circle Graph by Dragging
Loading the math board and drawing, please wait…
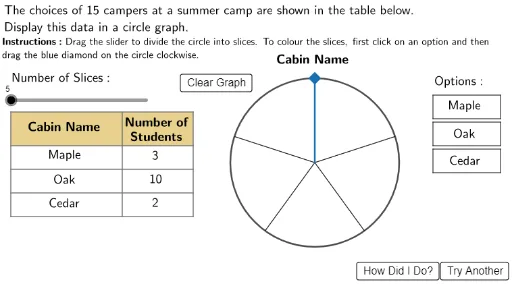
This example demonstrates how to create a circle graph by dragging points. It involves core math concepts such as circles, sectors, and percentages. Using GeoGebra commands like Circle and CircleSector, it visually represents data distribution. Suitable for middle school and above students to learn data statistics and graphical representation.
GeoGebra Commands & Parameters
Circle(Centre, circrad) → CircPoint(Circ) → P25Point(Circ) → P24Point(Circ) → P23Point(Circ) → P22Point(Circ) → P21Point(Circ) → P20Point(Circ) → P19Point(Circ) → P18Point(Circ) → P17Point(Circ) → P16Point(Circ) → P15Point(Circ) → P14Point(Circ) → P13Point(Circ) → P12Point(Circ) → P11Point(Circ) → P10Point(Circ) → P9Point(Circ) → P8Point(Circ) → P7Point(Circ) → P6Point(Circ) → P5Point(Circ) → P4Point(Circ) → P3Point(Circ) → P2Point(Circ) → P1Segment((0, 4.5), (5.4, 4.5)) → h1Segment((0, 3.5), (5.4, 3.5)) → h2Segment((0, 2.8), (5.4, 2.8)) → h3Segment((0, 2.1), (5.4, 2.1)) → h4Segment((0, 1.4), (5.4, 1.4)) → h5Segment((0, 4.5), (0, 1.4)) → v1Segment((3.3, 4.5), (3.3, 1.4)) → v2Segment((5.4, 4.5), (5.4, 1.4)) → v3Segment(Centre, P1) → Slice1Segment(Centre, P2) → Slice2Segment(Centre, P3) → Slice3Segment(Centre, P4) → Slice4Segment(Centre, P5) → Slice5Segment(Centre, P6) → Slice6Segment(Centre, P7) → Slice7Segment(Centre, P8) → Slice8Segment(Centre, P9) → Slice9Segment(Centre, P10) → Slice10Segment(Centre, P11) → Slice11Segment(Centre, P12) → Slice12Segment(Centre, P13) → Slice13Segment(Centre, P14) → Slice14Segment(Centre, P15) → Slice15Segment(Centre, P16) → Slice16Segment(Centre, P17) → Slice17Segment(Centre, P18) → Slice18Segment(Centre, P19) → Slice19Segment(Centre, P20) → Slice20Segment(Centre, P21) → Slice21Segment(Centre, P22) → Slice22Segment(Centre, P23) → Slice23Segment(Centre, P24) → Slice24Point(AllPoints) → R1Segment(Centre, P25) → Slice25Segment(Centre, R1) → R1SweepPolygon((12.5, 2.7), (14.5, 2.7), (14.5, 3.4), (12.5, 3.4)) → Option3Box, n, p, q, rPolygon((12.5, 5), (14.5, 5), (14.5, 4.3), (12.5, 4.3)) → Option1Box, f, g, h, iPolygon((12.5, 3.5), (14.5, 3.5), (14.5, 4.2), (12.5, 4.2)) → Option2Box, j, k, l, mCircleSector(Centre, R1, P1) → Section1Point(R2PointSpace) → R2Point(R3PointSpace) → R3Segment(Centre, R2) → R2SweepSegment(Centre, R3) → R3SweepCircleSector(Centre, R2, R1) → Section2CircleSector(Centre, R3, R2) → Section3Circle(Centre, (2 * circrad / 3)) → InnerCirc
AI Drawing Prompt Reference
Draw a circle with 25 evenly spaced points inside, connect each point to the circumference from the center to form sectors, and add horizontal and vertical lines to create an axis, visualizing data distribution as a pie chart.
The prompt above was compiled from the original drawing commands and is for reference only.