
COVID Trajectory: Mathematical Modeling with Geometric Distribution
Loading the math board and drawing, please wait…
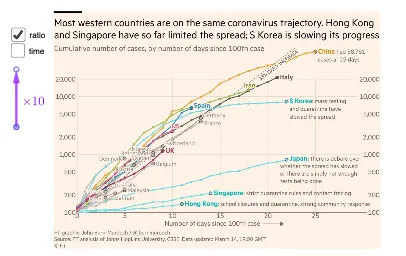
This example demonstrates the time series analysis of COVID data using geometric distribution and frequency distribution. Key mathematical concepts include logarithms, geometric distribution, frequency distribution, and integers. Construction involves using GeoGebra commands like Ray, Point, Vector, Line, and Distance to create data points, draw curves, and calculate distances. Suitable for high school students or college students learning probability statistics and data analysis.
GeoGebra Commands & Parameters
Ray(C, D) → fPoint(f) → EVector(C, E) → uRay(E, F) → gPoint(g) → GVector(E, G) → vLine(C, G) → hDistance(H, I) → dDistance(E, G) → p
AI Drawing Prompt Reference
Create a geometric model for COVID time series analysis. Start from the origin and draw a ray extending to the right, then pick a point on this ray as the first data point. From this point, draw another ray extending upward and pick a second point on this new ray. Connect the origin with the second point using a straight line. Measure and display the distance from the origin to the first data point, as well as the distance between the two data points. This visualization demonstrates data point distribution, vector relationships, and distance calculations for geometric and frequency distribution analysis.
The prompt above was compiled from the original drawing commands and is for reference only.