
Cosine Function by Steve Phelps
Loading the math board and drawing, please wait…
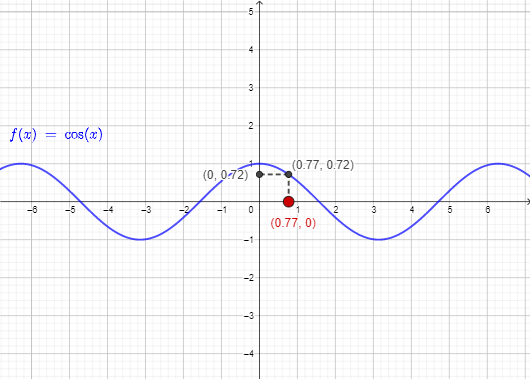
This example demonstrates the graph of the cosine function. It involves core concepts of trigonometry and shows the properties of the cosine function through the construction of points and segments. GeoGebra commands such as Point and Segment are used. Suitable for high school mathematics education and learning.
GeoGebra Commands & Parameters
Point(xAxis) → ASegment(A, B) → gSegment(B, C) → h
AI Drawing Prompt Reference
Please draw the basic graph of the cosine function, emphasizing a construction with connected key points: first place a reference point on the horizontal x-axis, then choose a corresponding second point, and finally select a third point adjacent to it. Connect these three points in order using line segments to form a connected polyline that serves as a scaffold for illustrating how cosine varies. Keep the focus on the relationships created by linking the three points sequentially.
The prompt above was compiled from the original drawing commands and is for reference only.