
Correlation as the Mean of Rectangle Areas
Loading the math board and drawing, please wait…
In collections
A Geometry Teacher Meets the Correlation Coefficient
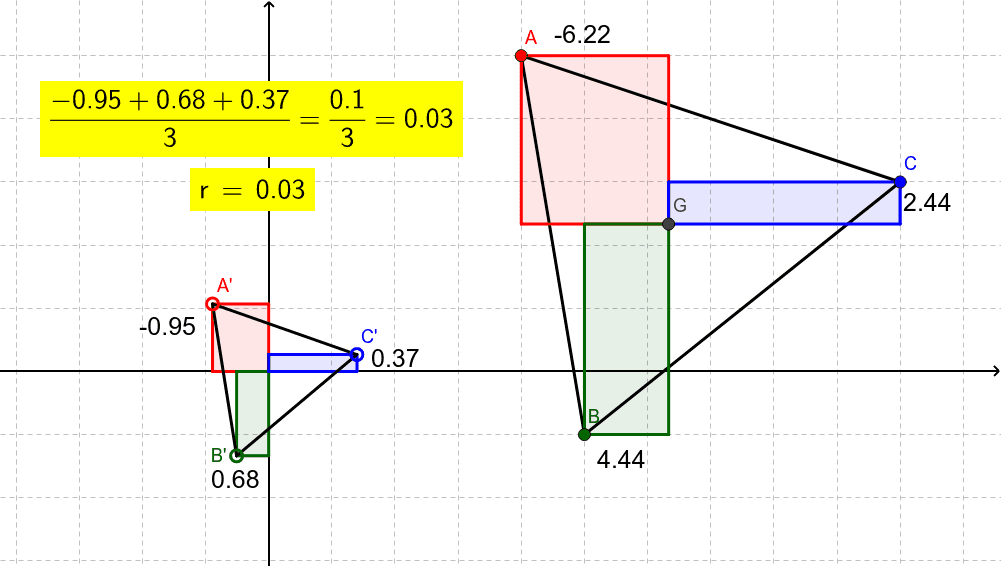
This GeoGebra example demonstrates a geometric interpretation of the Pearson correlation coefficient (PMCC) as the mean area of rectangles constructed from triangle vertices and the centroid. Given a triangle with vertices A, B, C and its centroid G, rectangles are formed using each vertex and the centroid as opposite vertices. The mean of these rectangle areas is shown to relate to the correlation coefficient of the data points. The construction involves core concepts from statistics (correlation), geometry (centroid, rectangles, areas), and their interplay. Key GeoGebra commands include Polygon, OrthogonalLine, Intersect, PMCC, and LaTeX for displaying formulas. Objects include the triangle, centroid, perpendicular lines, intersection points, rectangles, and auxiliary elements. This resource is suitable for high school or undergraduate students to visualize the geometric meaning of correlation, and for teachers to enrich lessons connecting statistics and geometry.
GeoGebra Commands & Parameters
Polygon(A, B, C) → poly1, c, a, bOrthogonalLine(D, yAxis) → dOrthogonalLine(D, xAxis) → eOrthogonalLine(E, xAxis) → fOrthogonalLine(E, yAxis) → gOrthogonalLine(F, yAxis) → hOrthogonalLine(F, xAxis) → iIntersect(yAxis, d) → IIntersect(xAxis, e) → JIntersect(f, xAxis) → KIntersect(yAxis, h) → LIntersect(yAxis, g) → MIntersect(i, xAxis) → NPolygon(H, I, D, J) → poly2, h_1, i_1, d_1, jPolygon(H, K, E, M) → poly3, h_2, k, e_1, mPolygon(H, L, F, N) → poly4, h_3, l, f_1, nPMCC({A, B, C}) → rLaTeX(r, true, true) → text1Polygon(D, F, E) → poly5, e_2, d_2, f_2OrthogonalLine(G, xAxis) → pOrthogonalLine(G, yAxis) → qOrthogonalLine(A, q) → sOrthogonalLine(A, p) → tOrthogonalLine(C, q) → a_1OrthogonalLine(C, p) → b_1OrthogonalLine(B, q) → c_1OrthogonalLine(B, p) → g_1Intersect(p, t) → OIntersect(q, c_1) → PIntersect(q, s) → QIntersect(p, g_1) → RIntersect(p, b_1) → SIntersect(q, a_1) → TPolygon(Q, A, O, G) → poly6, q_1, a_2, o_1, g_2Polygon(G, P, B, R) → poly7, g_3, p_1, b_2, r_1Polygon(G, S, C, T) → poly8, g_4, s_1, c_2, t_1
AI Drawing Prompt Reference
Draw a triangle and mark its centroid. Construct rectangles using each vertex and the centroid as opposite corners. Draw perpendicular lines from the centroid and each vertex to the x and y axes, creating intersection points that form additional rectangles. Calculate and display the mean area of these rectangles, which should relate to the Pearson correlation coefficient calculated from the triangle's vertices. The final image should include the original triangle, the centroid, perpendicular lines, intersection points, multiple rectangles, and the formula for the correlation coefficient.
The prompt above was compiled from the original drawing commands and is for reference only.