
Continuous Uniform (Rectangular) Distribution Visualization
Loading the math board and drawing, please wait…
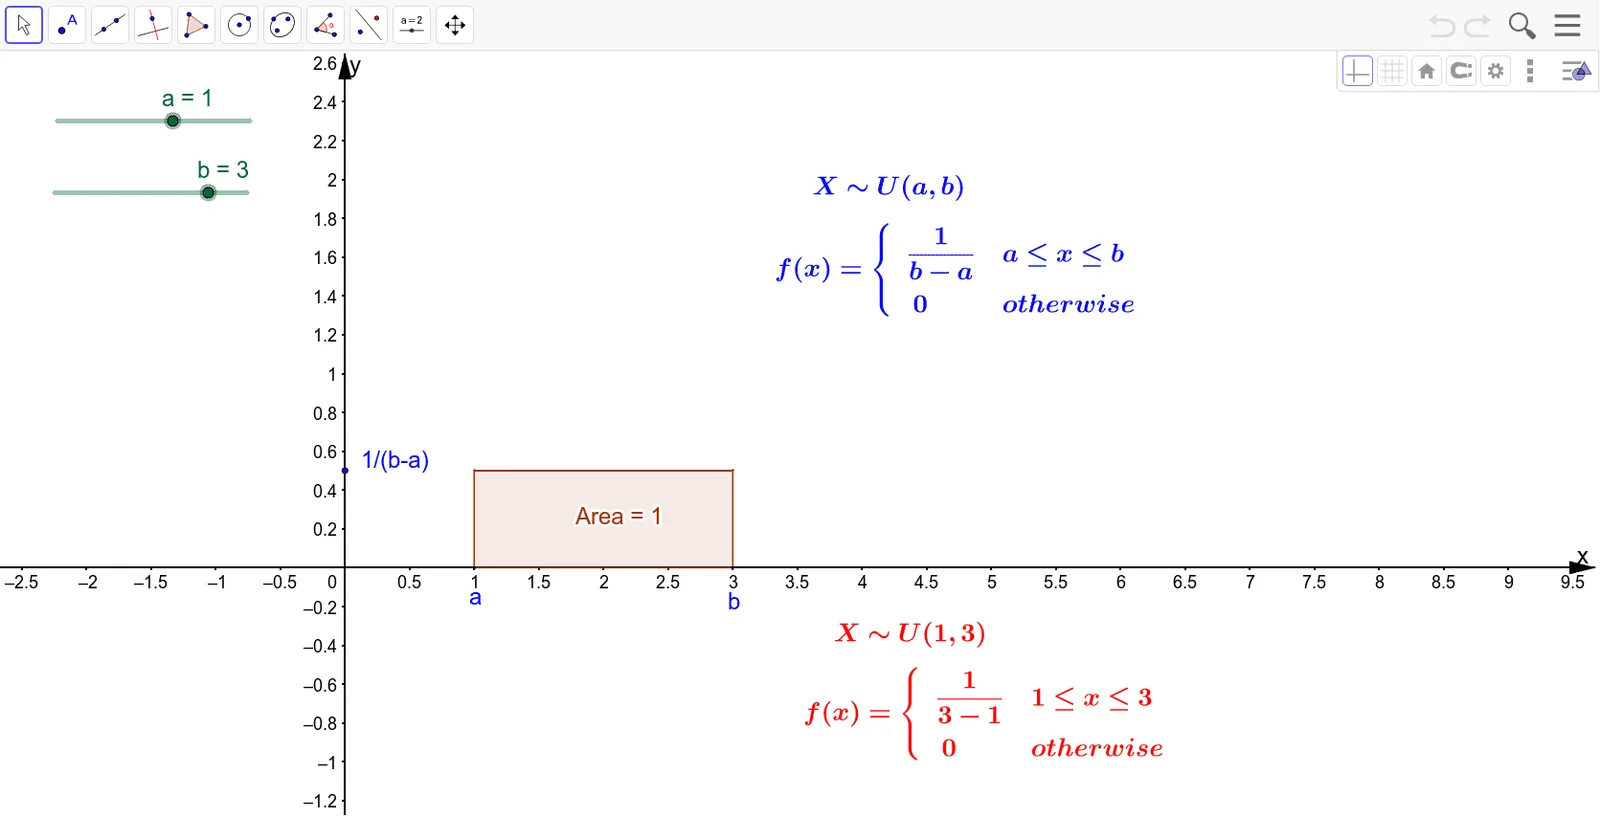
① This GeoGebra example dynamically illustrates the continuous uniform (rectangular) distribution, showing a constant probability density over a specified interval and zero elsewhere. ② Core mathematical concepts include continuous uniform distribution, probability density function, interval length vs. probability, and the equivalence between area under the curve and probability (integral). ③ Construction highlights: based on the summary, it uses the Polygon command to build the rectangular region, involving objects a, b, A, B, g, f, c, C, D, E, computes the area (Area), and uses text objects (text1, text2, text4, text3) to label parameters and results; it may also include an ellipse and ratios as auxiliary visual aids. ④ Suitable for high school to early college probability and statistics courses, this example helps students understand the definition of uniform distribution, probability calculation, and the geometric interpretation of probability as area, and can serve as a classroom demonstration or self-study tool.
GeoGebra Commands & Parameters
Polygon(A, B, E, D) → Area, a_1, b_1, e, d
AI Drawing Prompt Reference
Draw a rectangular region to represent the probability density function of a continuous uniform distribution. The base of the rectangle lies on the x-axis, with length defined by two points a and b, and a height of 1. Use the Polygon command to draw the rectangle, calculate and display its area as a geometric interpretation of probability. Add text annotations for parameters a, b, and area, and possibly include auxiliary graphics like an ellipse and ratio relationships.
The prompt above was compiled from the original drawing commands and is for reference only.