
Continuity Condition Demonstration by Todd Fogdall
Loading the math board and drawing, please wait…
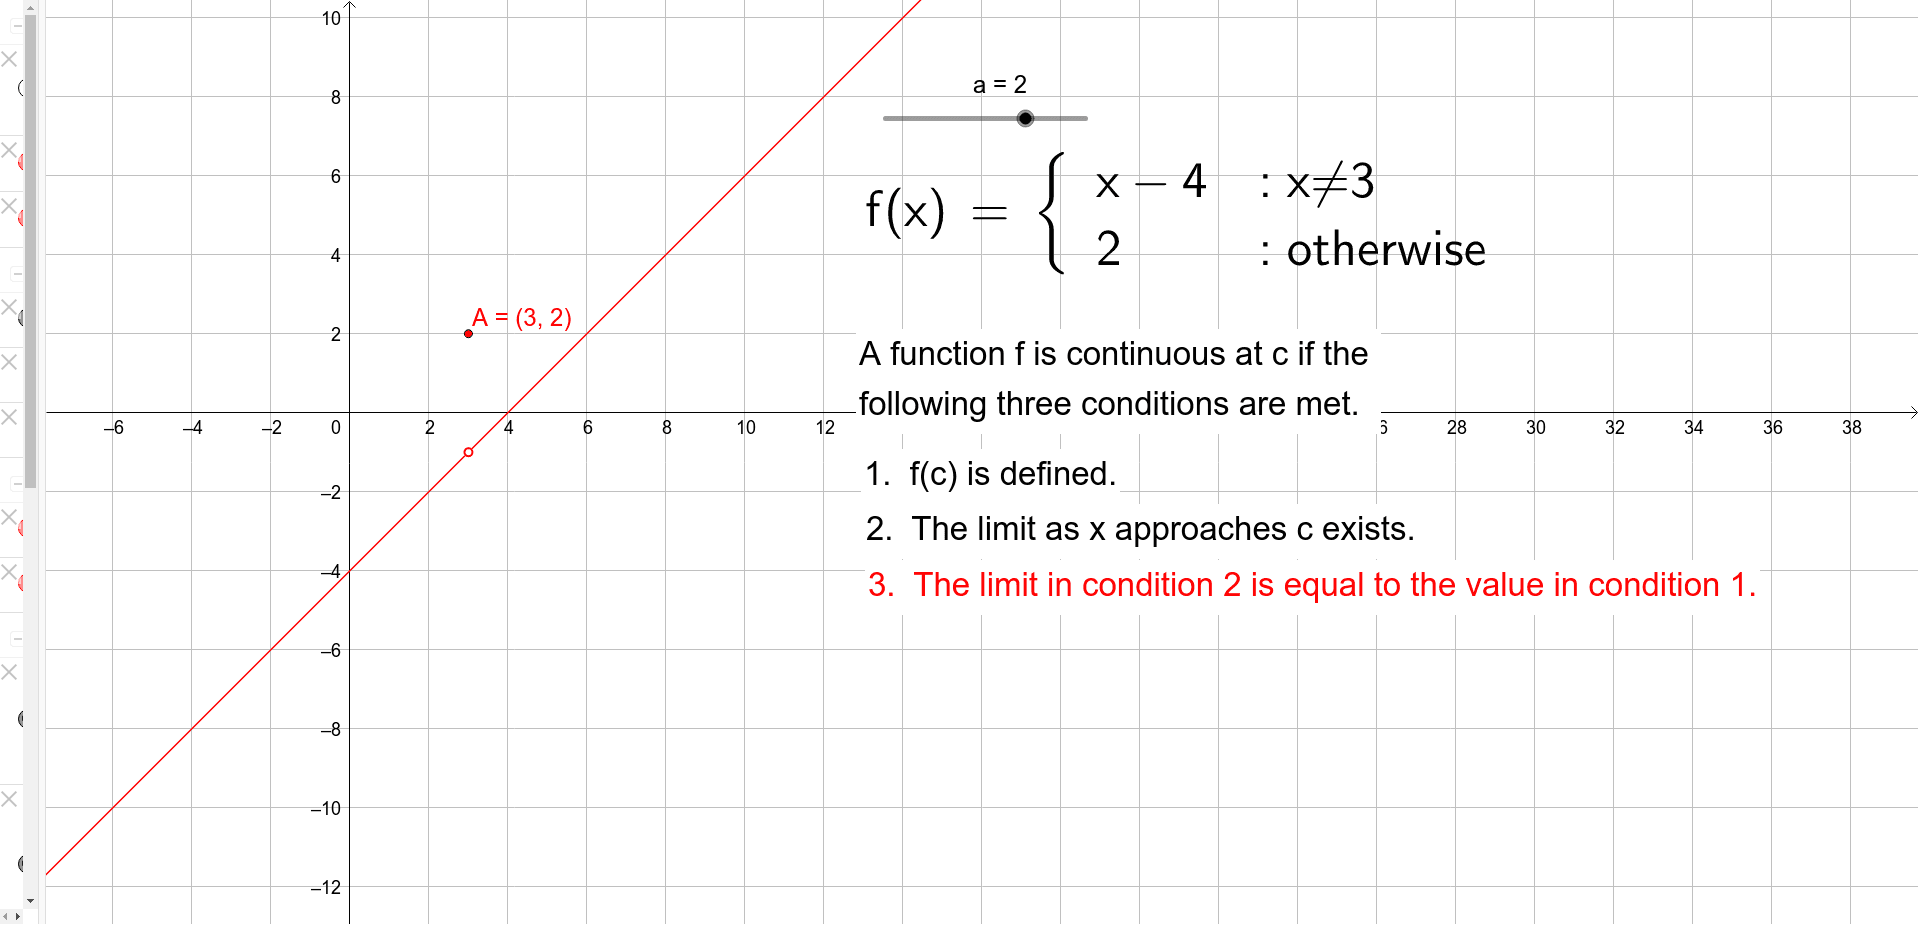
This example visually demonstrates the concept of function continuity at a specific point. It involves core mathematical concepts such as continuity definition, function graphs, and geometric construction. Key GeoGebra commands used include Point, LaTeX for text rendering, and objects like a, f, b, c, A, B, g, h, along with text and condition objects. Suitable for high school students and beginners in differential calculus.
GeoGebra Commands & Parameters
Point({3, a}) → APoint({3, -1}) → BLaTeX(f, true, true) → text1
AI Drawing Prompt Reference
Draw a diagram showing the continuity of a function at the point (3, -1). Include a point A at (3, a) and another point B at (3, -1). Use text to label the function f. Keep the diagram simple for beginners to understand the concept of continuity.
The prompt above was compiled from the original drawing commands and is for reference only.